MirzaInternational MIRZAINT full analysis,charts,indicators,moving averages,SMA,DMA,EMA,ADX,MACD,RSIMirza International MIRZAINT WideScreen charts, DMA,SMA,EMA technical analysis, forecast prediction, by indicators ADX,MACD,RSI,CCI NSE stock exchange
operates under Footwear sector
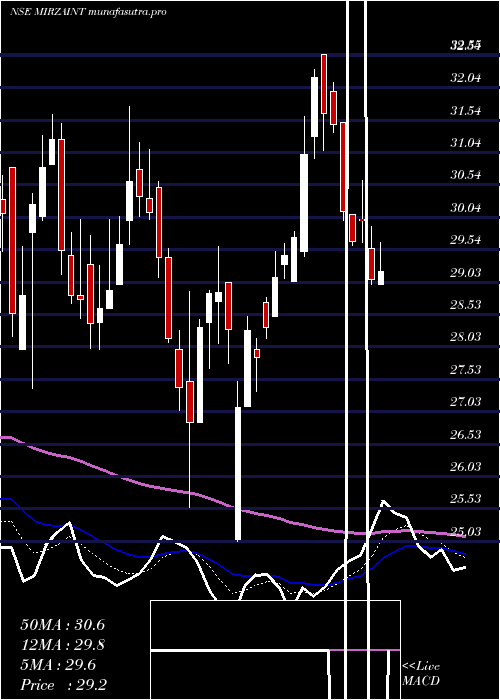
Daily price and charts and targets MirzaInternational Strong Daily Stock price targets for MirzaInternational MIRZAINT are 36.92 and 37.73 | Daily Target 1 | 36.74 | | Daily Target 2 | 37.1 | | Daily Target 3 | 37.55 | | Daily Target 4 | 37.91 | | Daily Target 5 | 38.36 |
Daily price and volume Mirza International
| Date |
Closing |
Open |
Range |
Volume |
Tue 28 October 2025 |
37.46 (-0.08%) |
38.00 |
37.19 - 38.00 |
0.5123 times |
Mon 27 October 2025 |
37.49 (-3.55%) |
39.17 |
36.26 - 39.17 |
1.2948 times |
Fri 24 October 2025 |
38.87 (0.23%) |
38.78 |
38.46 - 39.83 |
0.5393 times |
Thu 23 October 2025 |
38.78 (-0.23%) |
39.20 |
38.64 - 39.76 |
0.8629 times |
Tue 21 October 2025 |
38.87 (-0.79%) |
40.50 |
38.75 - 40.50 |
0.6279 times |
Mon 20 October 2025 |
39.18 (-0.63%) |
39.58 |
38.71 - 39.59 |
0.8925 times |
Fri 17 October 2025 |
39.43 (3.44%) |
38.15 |
38.15 - 40.90 |
3.2297 times |
Thu 16 October 2025 |
38.12 (0.69%) |
38.15 |
38.00 - 38.71 |
0.572 times |
Wed 15 October 2025 |
37.86 (-1.25%) |
38.75 |
37.38 - 38.98 |
0.9319 times |
Tue 14 October 2025 |
38.34 (-2.69%) |
39.40 |
38.25 - 39.66 |
0.5365 times |
Mon 13 October 2025 |
39.40 (-1.01%) |
39.75 |
38.26 - 39.75 |
0.8481 times |
Weekly price and charts MirzaInternational Strong weekly Stock price targets for MirzaInternational MIRZAINT are 35.41 and 38.32 | Weekly Target 1 | 34.72 | | Weekly Target 2 | 36.09 | | Weekly Target 3 | 37.63 | | Weekly Target 4 | 39 | | Weekly Target 5 | 40.54 |
Weekly price and volumes for Mirza International
| Date |
Closing |
Open |
Range |
Volume |
Tue 28 October 2025 |
37.46 (-3.63%) |
39.17 |
36.26 - 39.17 |
0.286 times |
Fri 24 October 2025 |
38.87 (-1.42%) |
39.58 |
38.46 - 40.50 |
0.4625 times |
Fri 17 October 2025 |
39.43 (-0.93%) |
39.75 |
37.38 - 40.90 |
0.9683 times |
Fri 10 October 2025 |
39.80 (2.82%) |
38.75 |
36.50 - 41.60 |
1.6607 times |
Fri 03 October 2025 |
38.71 (-2.25%) |
39.92 |
38.37 - 41.59 |
0.5577 times |
Fri 26 September 2025 |
39.60 (-6.91%) |
42.83 |
37.40 - 43.29 |
1.1361 times |
Fri 19 September 2025 |
42.54 (27.17%) |
33.90 |
32.73 - 44.00 |
4.1141 times |
Fri 12 September 2025 |
33.45 (-0.45%) |
33.60 |
33.02 - 34.55 |
0.2182 times |
Fri 05 September 2025 |
33.60 (4.84%) |
32.10 |
32.10 - 35.84 |
0.4447 times |
Fri 29 August 2025 |
32.05 (-3.38%) |
33.79 |
31.74 - 33.79 |
0.1517 times |
Fri 22 August 2025 |
33.17 (1.56%) |
33.10 |
33.01 - 34.95 |
0.2823 times |

Monthly price and charts MirzaInternational Strong monthly Stock price targets for MirzaInternational MIRZAINT are 34.19 and 39.53 | Monthly Target 1 | 33.1 | | Monthly Target 2 | 35.28 | | Monthly Target 3 | 38.44 | | Monthly Target 4 | 40.62 | | Monthly Target 5 | 43.78 |
Monthly price and volumes Mirza International
| Date |
Closing |
Open |
Range |
Volume |
Tue 28 October 2025 |
37.46 (-3.2%) |
38.74 |
36.26 - 41.60 |
1.1152 times |
Tue 30 September 2025 |
38.70 (20.75%) |
32.10 |
32.10 - 44.00 |
1.9328 times |
Fri 29 August 2025 |
32.05 (-3.72%) |
33.29 |
31.74 - 38.99 |
1.0672 times |
Thu 31 July 2025 |
33.29 (2.78%) |
32.13 |
31.50 - 38.40 |
1.3051 times |
Mon 30 June 2025 |
32.39 (4.18%) |
31.08 |
28.10 - 33.90 |
0.7761 times |
Fri 30 May 2025 |
31.09 (6.95%) |
29.00 |
27.95 - 33.18 |
0.3937 times |
Wed 30 April 2025 |
29.07 (8.23%) |
26.86 |
25.03 - 32.55 |
0.4049 times |
Fri 28 March 2025 |
26.86 (-10.76%) |
30.80 |
25.55 - 31.75 |
0.6585 times |
Fri 28 February 2025 |
30.10 (-5.67%) |
38.15 |
29.51 - 44.64 |
2.0043 times |
Fri 31 January 2025 |
31.91 (-15.87%) |
37.35 |
30.62 - 39.09 |
0.3422 times |
Tue 31 December 2024 |
37.93 (-2.62%) |
38.90 |
36.55 - 40.99 |
0.4832 times |
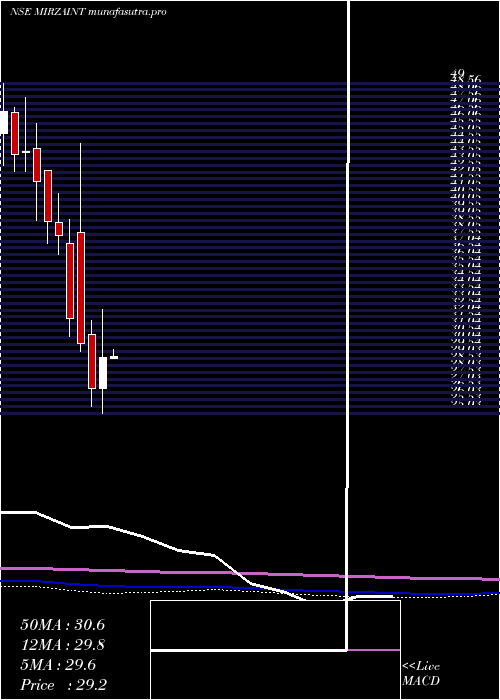
DMA SMA EMA moving averages of Mirza International MIRZAINT
DMA (daily moving average) of Mirza International MIRZAINT
| DMA period | DMA value | | 5 day DMA | 38.29 | | 12 day DMA | 38.63 | | 20 day DMA | 38.56 | | 35 day DMA | 38.13 | | 50 day DMA | 36.61 | | 100 day DMA | 34.58 | | 150 day DMA | 33.02 | | 200 day DMA | 33.08 | EMA (exponential moving average) of Mirza International MIRZAINT
| EMA period | EMA current | EMA prev | EMA prev2 | | 5 day EMA | 38.08 | 38.39 | 38.84 | | 12 day EMA | 38.37 | 38.54 | 38.73 | | 20 day EMA | 38.3 | 38.39 | 38.48 | | 35 day EMA | 37.41 | 37.41 | 37.4 | | 50 day EMA | 36.52 | 36.48 | 36.44 |
SMA (simple moving average) of Mirza International MIRZAINT
| SMA period | SMA current | SMA prev | SMA prev2 | | 5 day SMA | 38.29 | 38.64 | 39.03 | | 12 day SMA | 38.63 | 38.57 | 38.58 | | 20 day SMA | 38.56 | 38.67 | 38.69 | | 35 day SMA | 38.13 | 38.02 | 37.93 | | 50 day SMA | 36.61 | 36.52 | 36.44 | | 100 day SMA | 34.58 | 34.51 | 34.44 | | 150 day SMA | 33.02 | 32.97 | 32.91 | | 200 day SMA | 33.08 | 33.07 | 33.08 |
|
|
