MindaCorporation MINDACORP full analysis,charts,indicators,moving averages,SMA,DMA,EMA,ADX,MACD,RSIMinda Corporation MINDACORP WideScreen charts, DMA,SMA,EMA technical analysis, forecast prediction, by indicators ADX,MACD,RSI,CCI NSE stock exchange
Daily price and charts and targets MindaCorporation Strong Daily Stock price targets for MindaCorporation MINDACORP are 570.05 and 583.55 | Daily Target 1 | 559.37 | | Daily Target 2 | 567.23 | | Daily Target 3 | 572.86666666667 | | Daily Target 4 | 580.73 | | Daily Target 5 | 586.37 |
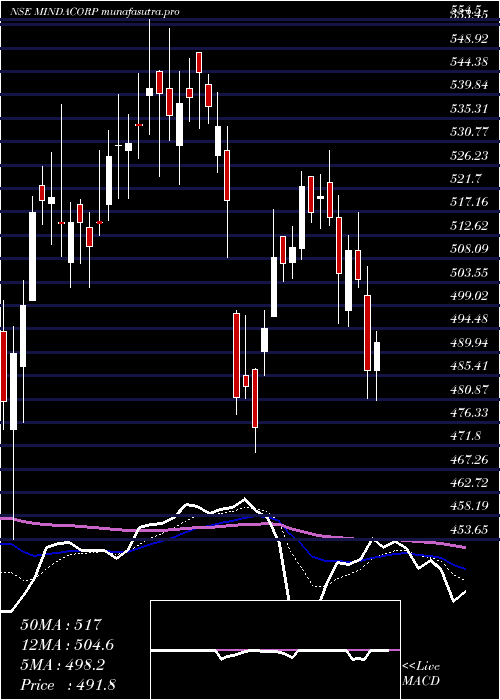
Daily price and volume Minda Corporation
| Date |
Closing |
Open |
Range |
Volume |
Wed 29 October 2025 |
575.10 (1.49%) |
566.65 |
565.00 - 578.50 |
0.9408 times |
Tue 28 October 2025 |
566.65 (0.68%) |
567.00 |
564.50 - 572.90 |
0.5384 times |
Mon 27 October 2025 |
562.80 (-0.4%) |
565.05 |
560.00 - 567.90 |
0.6409 times |
Fri 24 October 2025 |
565.05 (-0.38%) |
567.75 |
563.05 - 578.40 |
1.2977 times |
Thu 23 October 2025 |
567.20 (-1.69%) |
585.00 |
565.20 - 585.00 |
0.6561 times |
Tue 21 October 2025 |
576.95 (-0.08%) |
581.65 |
567.90 - 587.60 |
0.3962 times |
Mon 20 October 2025 |
577.40 (1.57%) |
571.50 |
569.00 - 580.00 |
1.0205 times |
Fri 17 October 2025 |
568.50 (-2.5%) |
581.25 |
566.55 - 584.80 |
1.2768 times |
Thu 16 October 2025 |
583.05 (2.51%) |
569.90 |
569.90 - 588.00 |
2.1847 times |
Wed 15 October 2025 |
568.75 (0.81%) |
564.60 |
559.40 - 572.00 |
1.048 times |
Tue 14 October 2025 |
564.20 (-0.96%) |
570.05 |
553.25 - 572.00 |
2.2276 times |
Weekly price and charts MindaCorporation Strong weekly Stock price targets for MindaCorporation MINDACORP are 567.55 and 586.05 | Weekly Target 1 | 552.7 | | Weekly Target 2 | 563.9 | | Weekly Target 3 | 571.2 | | Weekly Target 4 | 582.4 | | Weekly Target 5 | 589.7 |
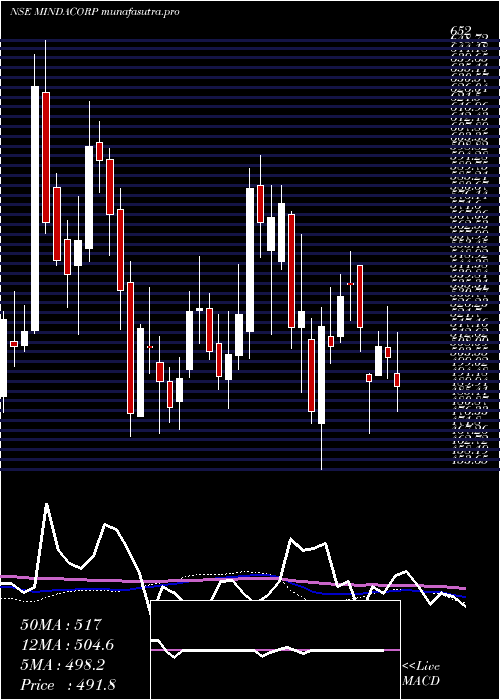
Weekly price and volumes for Minda Corporation
| Date |
Closing |
Open |
Range |
Volume |
Wed 29 October 2025 |
575.10 (1.78%) |
565.05 |
560.00 - 578.50 |
0.0985 times |
Fri 24 October 2025 |
565.05 (-0.61%) |
571.50 |
563.05 - 587.60 |
0.1566 times |
Fri 17 October 2025 |
568.50 (-3.47%) |
587.10 |
553.25 - 588.00 |
0.5311 times |
Fri 10 October 2025 |
588.95 (0.11%) |
590.90 |
572.85 - 606.90 |
0.8633 times |
Fri 03 October 2025 |
588.30 (2.98%) |
578.00 |
565.10 - 594.00 |
0.811 times |
Fri 26 September 2025 |
571.30 (4.01%) |
550.00 |
530.05 - 601.65 |
6.0639 times |
Fri 19 September 2025 |
549.25 (7.36%) |
511.60 |
508.50 - 550.50 |
0.4532 times |
Fri 12 September 2025 |
511.60 (1.51%) |
504.80 |
503.40 - 528.80 |
0.2216 times |
Fri 05 September 2025 |
504.00 (1.03%) |
498.05 |
498.05 - 518.90 |
0.3268 times |
Fri 29 August 2025 |
498.85 (-1.77%) |
510.25 |
495.00 - 521.70 |
0.4739 times |
Fri 22 August 2025 |
507.85 (2.56%) |
509.90 |
496.80 - 519.55 |
0.2335 times |
Monthly price and charts MindaCorporation Strong monthly Stock price targets for MindaCorporation MINDACORP are 564.18 and 617.83 | Monthly Target 1 | 524.77 | | Monthly Target 2 | 549.93 | | Monthly Target 3 | 578.41666666667 | | Monthly Target 4 | 603.58 | | Monthly Target 5 | 632.07 |
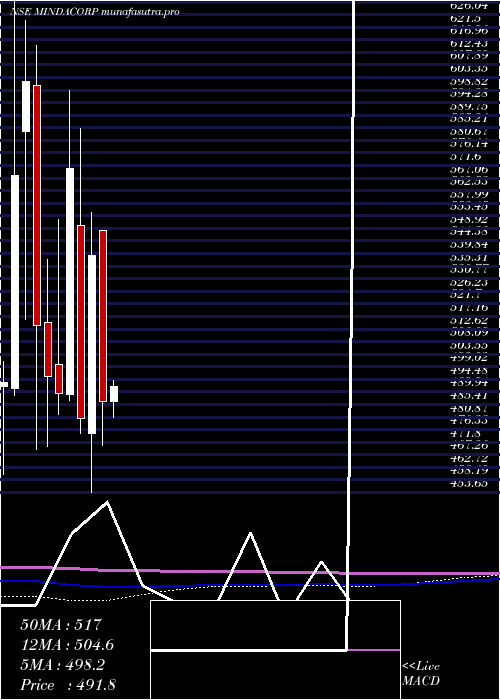
Monthly price and volumes Minda Corporation
| Date |
Closing |
Open |
Range |
Volume |
Wed 29 October 2025 |
575.10 (0.99%) |
575.00 |
553.25 - 606.90 |
0.8776 times |
Tue 30 September 2025 |
569.45 (14.15%) |
498.05 |
498.05 - 601.65 |
3.2931 times |
Fri 29 August 2025 |
498.85 (-0.09%) |
499.00 |
445.05 - 521.70 |
0.6151 times |
Thu 31 July 2025 |
499.30 (-4.26%) |
523.45 |
496.85 - 542.30 |
0.6714 times |
Mon 30 June 2025 |
521.50 (-0.24%) |
523.10 |
498.00 - 584.90 |
0.5869 times |
Fri 30 May 2025 |
522.75 (7.46%) |
486.45 |
459.90 - 556.85 |
0.5232 times |
Wed 30 April 2025 |
486.45 (-9.8%) |
548.00 |
470.50 - 548.00 |
0.2472 times |
Fri 28 March 2025 |
539.30 (12.28%) |
475.00 |
453.65 - 554.50 |
0.5711 times |
Fri 28 February 2025 |
480.30 (-15.8%) |
550.00 |
474.95 - 585.00 |
0.691 times |
Fri 31 January 2025 |
570.40 (16.53%) |
489.00 |
487.00 - 598.80 |
1.9233 times |
Tue 31 December 2024 |
489.50 (-1.22%) |
499.85 |
481.95 - 552.00 |
0.6311 times |
DMA SMA EMA moving averages of Minda Corporation MINDACORP
DMA (daily moving average) of Minda Corporation MINDACORP
| DMA period | DMA value | | 5 day DMA | 567.36 | | 12 day DMA | 570.44 | | 20 day DMA | 575.5 | | 35 day DMA | 558.73 | | 50 day DMA | 543.19 | | 100 day DMA | 529.02 | | 150 day DMA | 523.2 | | 200 day DMA | 526.91 | EMA (exponential moving average) of Minda Corporation MINDACORP
| EMA period | EMA current | EMA prev | EMA prev2 | | 5 day EMA | 569.95 | 567.37 | 567.73 | | 12 day EMA | 570.64 | 569.83 | 570.41 | | 20 day EMA | 567.76 | 566.99 | 567.03 | | 35 day EMA | 555.14 | 553.96 | 553.21 | | 50 day EMA | 540.04 | 538.61 | 537.47 |
SMA (simple moving average) of Minda Corporation MINDACORP
| SMA period | SMA current | SMA prev | SMA prev2 | | 5 day SMA | 567.36 | 567.73 | 569.88 | | 12 day SMA | 570.44 | 571.6 | 572.88 | | 20 day SMA | 575.5 | 575.19 | 575.42 | | 35 day SMA | 558.73 | 557.17 | 555.38 | | 50 day SMA | 543.19 | 541.59 | 540.07 | | 100 day SMA | 529.02 | 528.64 | 528.14 | | 150 day SMA | 523.2 | 522.9 | 522.66 | | 200 day SMA | 526.91 | 526.69 | 526.4 |
|
|
