MiltonIndustries MILTON_SM full analysis,charts,indicators,moving averages,SMA,DMA,EMA,ADX,MACD,RSIMilton Industries MILTON_SM WideScreen charts, DMA,SMA,EMA technical analysis, forecast prediction, by indicators ADX,MACD,RSI,CCI NSE stock exchange
Daily price and charts and targets MiltonIndustries Strong Daily Stock price targets for MiltonIndustries MILTON_SM are 33.6 and 33.6 | Daily Target 1 | 33.6 | | Daily Target 2 | 33.6 | | Daily Target 3 | 33.6 | | Daily Target 4 | 33.6 | | Daily Target 5 | 33.6 |
Daily price and volume Milton Industries
| Date |
Closing |
Open |
Range |
Volume |
| Tue 29 April 2025 |
33.60 (9.98%) |
33.60 |
33.60 - 33.60 |
0.7143 times |
| Tue 22 April 2025 |
30.55 (4.8%) |
30.60 |
30.55 - 30.60 |
2.8571 times |
| Mon 21 April 2025 |
29.15 (0%) |
29.15 |
29.15 - 29.15 |
0.7143 times |
| Tue 08 April 2025 |
29.15 (0%) |
29.15 |
29.15 - 29.15 |
0.7143 times |
| Fri 28 March 2025 |
29.15 (4.86%) |
29.15 |
29.15 - 29.15 |
0.7143 times |
| Wed 19 March 2025 |
27.80 (4.91%) |
27.80 |
27.80 - 27.80 |
0.7143 times |
| Tue 18 March 2025 |
26.50 (0%) |
26.50 |
26.50 - 26.50 |
0.7143 times |
| Mon 17 March 2025 |
26.50 (-0.38%) |
26.50 |
26.50 - 26.50 |
0.7143 times |
| Wed 12 March 2025 |
26.60 (-5%) |
26.75 |
26.60 - 26.75 |
1.4286 times |
| Mon 10 March 2025 |
28.00 (-3.45%) |
28.00 |
28.00 - 28.00 |
0.7143 times |
| Thu 06 March 2025 |
29.00 (0%) |
29.00 |
29.00 - 29.00 |
0.7143 times |
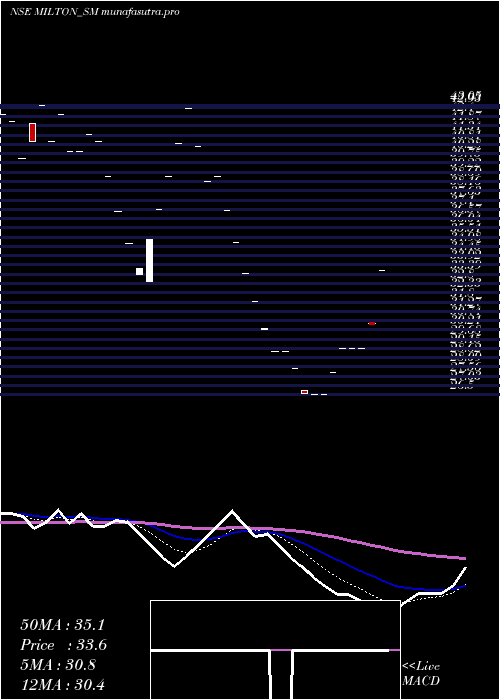
Weekly price and charts MiltonIndustries Strong weekly Stock price targets for MiltonIndustries MILTON_SM are 33.6 and 33.6 | Weekly Target 1 | 33.6 | | Weekly Target 2 | 33.6 | | Weekly Target 3 | 33.6 | | Weekly Target 4 | 33.6 | | Weekly Target 5 | 33.6 |
Weekly price and volumes for Milton Industries
| Date |
Closing |
Open |
Range |
Volume |
| Tue 29 April 2025 |
33.60 (9.98%) |
33.60 |
33.60 - 33.60 |
0.2326 times |
| Tue 22 April 2025 |
30.55 (4.8%) |
29.15 |
29.15 - 30.60 |
1.1628 times |
| Tue 08 April 2025 |
29.15 (0%) |
29.15 |
29.15 - 29.15 |
0.2326 times |
| Fri 28 March 2025 |
29.15 (9.59%) |
26.50 |
26.50 - 29.15 |
0.9302 times |
| Wed 12 March 2025 |
26.60 (-8.28%) |
28.00 |
26.60 - 28.00 |
0.6977 times |
| Thu 06 March 2025 |
29.00 (-13.3%) |
31.85 |
29.00 - 31.85 |
4.8837 times |
| Fri 28 February 2025 |
33.45 (-4.97%) |
33.45 |
33.45 - 33.45 |
0.2326 times |
| Fri 14 February 2025 |
35.20 (-9.74%) |
37.05 |
35.20 - 37.05 |
0.4651 times |
| Fri 10 January 2025 |
39.00 (-8.98%) |
40.70 |
38.70 - 40.70 |
0.9302 times |
| Mon 09 December 2024 |
42.85 (4.9%) |
42.85 |
42.85 - 42.85 |
0.2326 times |
| Fri 06 December 2024 |
40.85 (21.22%) |
33.00 |
33.00 - 40.85 |
1.6279 times |

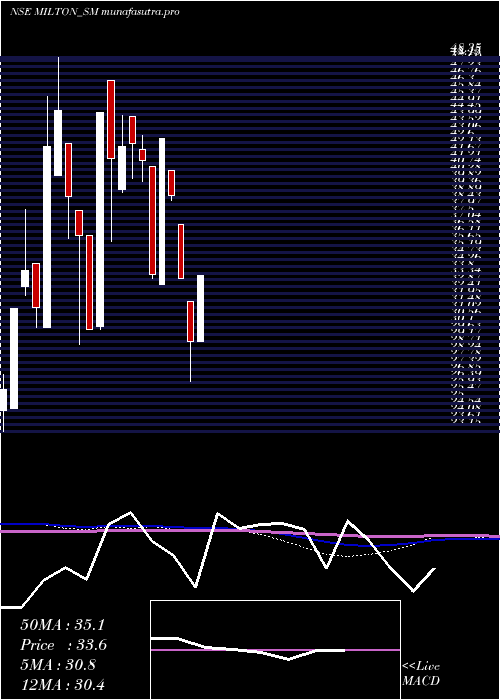
Monthly price and charts MiltonIndustries Strong monthly Stock price targets for MiltonIndustries MILTON_SM are 31.38 and 35.83 | Monthly Target 1 | 27.67 | | Monthly Target 2 | 30.63 | | Monthly Target 3 | 32.116666666667 | | Monthly Target 4 | 35.08 | | Monthly Target 5 | 36.57 |
Monthly price and volumes Milton Industries
| Date |
Closing |
Open |
Range |
Volume |
| Tue 29 April 2025 |
33.60 (15.27%) |
29.15 |
29.15 - 33.60 |
0.407 times |
| Fri 28 March 2025 |
29.15 (-12.86%) |
31.85 |
26.50 - 31.85 |
1.6279 times |
| Fri 28 February 2025 |
33.45 (-14.23%) |
37.05 |
33.45 - 37.05 |
0.1744 times |
| Fri 10 January 2025 |
39.00 (-8.98%) |
40.70 |
38.70 - 40.70 |
0.2326 times |
| Mon 09 December 2024 |
42.85 (27.15%) |
33.00 |
33.00 - 42.85 |
0.4651 times |
| Thu 28 November 2024 |
33.70 (-18.6%) |
41.00 |
33.40 - 41.00 |
0.814 times |
| Thu 31 October 2024 |
41.40 (-2.59%) |
42.10 |
40.00 - 43.05 |
0.6977 times |
| Fri 27 September 2024 |
42.50 (0.47%) |
44.35 |
40.15 - 44.35 |
1.4535 times |
| Fri 30 August 2024 |
42.30 (1.93%) |
39.45 |
39.20 - 44.40 |
2.3837 times |
| Tue 30 July 2024 |
41.50 (-6.95%) |
46.80 |
35.95 - 46.80 |
1.7442 times |
| Fri 28 June 2024 |
44.60 (48.67%) |
30.20 |
30.00 - 44.60 |
4.4186 times |
DMA SMA EMA moving averages of Milton Industries MILTON_SM
DMA (daily moving average) of Milton Industries MILTON_SM
| DMA period | DMA value | | 5 day DMA | 30.32 | | 12 day DMA | 28.75 | | 20 day DMA | 31.56 | | 35 day DMA | 34.79 | | 50 day DMA | 37.05 | | 100 day DMA | 37.98 | | 150 day DMA | 38.49 | | 200 day DMA | 36.52 | EMA (exponential moving average) of Milton Industries MILTON_SM
| EMA period | EMA current | EMA prev | EMA prev2 | | 5 day EMA | 30.75 | 29.32 | 28.7 | | 12 day EMA | 30.39 | 29.81 | 29.67 | | 20 day EMA | 31.57 | 31.36 | 31.45 | | 35 day EMA | 33.98 | 34 | 34.2 | | 50 day EMA | 36.8 | 36.93 | 37.19 |
SMA (simple moving average) of Milton Industries MILTON_SM
| SMA period | SMA current | SMA prev | SMA prev2 | | 5 day SMA | 30.32 | 29.16 | 28.35 | | 12 day SMA | 28.75 | 28.48 | 28.58 | | 20 day SMA | 31.56 | 32.03 | 32.54 | | 35 day SMA | 34.79 | 35.06 | 35.36 | | 50 day SMA | 37.05 | 37.18 | 37.42 | | 100 day SMA | 37.98 | 38.01 | 38.07 | | 150 day SMA | 38.49 | 38.5 | 38.51 | | 200 day SMA | 36.52 | 36.48 | 36.46 |
|
|
