ManglamInfra MIEL_ST full analysis,charts,indicators,moving averages,SMA,DMA,EMA,ADX,MACD,RSIManglam Infra MIEL_ST WideScreen charts, DMA,SMA,EMA technical analysis, forecast prediction, by indicators ADX,MACD,RSI,CCI NSE stock exchange
Daily price and charts and targets ManglamInfra Strong Daily Stock price targets for ManglamInfra MIEL_ST are 22.08 and 22.13 | Daily Target 1 | 22.03 | | Daily Target 2 | 22.07 | | Daily Target 3 | 22.083333333333 | | Daily Target 4 | 22.12 | | Daily Target 5 | 22.13 |
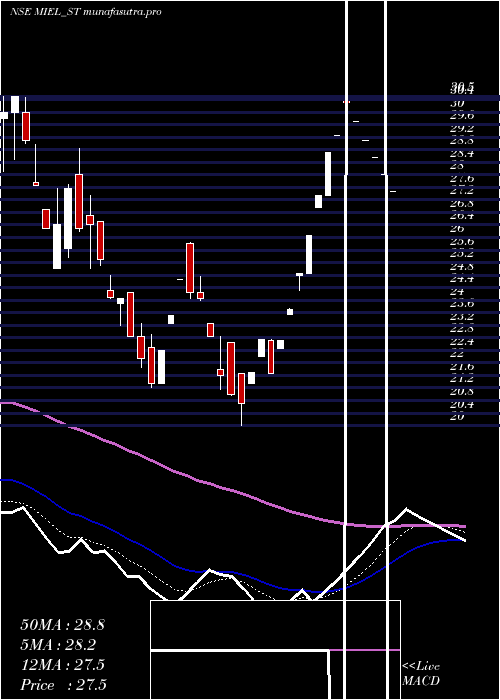
Daily price and volume Manglam Infra
| Date |
Closing |
Open |
Range |
Volume |
Tue 28 October 2025 |
22.10 (4.99%) |
22.05 |
22.05 - 22.10 |
0.4688 times |
Fri 24 October 2025 |
21.05 (-1.86%) |
21.05 |
21.05 - 21.05 |
0.1563 times |
Thu 23 October 2025 |
21.45 (-0.92%) |
21.45 |
21.45 - 21.45 |
0.3125 times |
Mon 20 October 2025 |
21.65 (-3.99%) |
21.50 |
21.50 - 21.65 |
0.3125 times |
Fri 17 October 2025 |
22.55 (4.88%) |
21.65 |
20.45 - 22.55 |
5.4688 times |
Thu 16 October 2025 |
21.50 (0%) |
21.50 |
21.40 - 21.50 |
0.4688 times |
Wed 15 October 2025 |
21.50 (-2.27%) |
22.00 |
21.50 - 22.40 |
1.0938 times |
Tue 14 October 2025 |
22.00 (-2.65%) |
22.10 |
22.00 - 22.10 |
0.625 times |
Mon 13 October 2025 |
22.60 (0%) |
23.00 |
22.60 - 23.00 |
0.4688 times |
Thu 09 October 2025 |
22.60 (-1.74%) |
22.00 |
22.00 - 22.60 |
0.625 times |
Wed 08 October 2025 |
23.00 (4.31%) |
22.05 |
22.05 - 23.00 |
0.4688 times |
Weekly price and charts ManglamInfra Strong weekly Stock price targets for ManglamInfra MIEL_ST are 22.08 and 22.13 | Weekly Target 1 | 22.03 | | Weekly Target 2 | 22.07 | | Weekly Target 3 | 22.083333333333 | | Weekly Target 4 | 22.12 | | Weekly Target 5 | 22.13 |
Weekly price and volumes for Manglam Infra
| Date |
Closing |
Open |
Range |
Volume |
Tue 28 October 2025 |
22.10 (4.99%) |
22.05 |
22.05 - 22.10 |
0.1255 times |
Fri 24 October 2025 |
21.05 (-6.65%) |
21.50 |
21.05 - 21.65 |
0.2092 times |
Fri 17 October 2025 |
22.55 (-0.22%) |
23.00 |
20.45 - 23.00 |
2.1757 times |
Thu 09 October 2025 |
22.60 (-3.83%) |
23.50 |
22.00 - 23.50 |
0.7531 times |
Fri 03 October 2025 |
23.50 (-4.47%) |
24.50 |
23.50 - 25.30 |
0.5439 times |
Fri 26 September 2025 |
24.60 (-1.99%) |
23.95 |
23.50 - 25.90 |
0.6695 times |
Fri 19 September 2025 |
25.10 (-3.83%) |
25.10 |
24.90 - 26.15 |
0.6276 times |
Fri 12 September 2025 |
26.10 (27.94%) |
29.40 |
26.10 - 29.40 |
1.2971 times |
Fri 01 August 2025 |
20.40 (-8.31%) |
21.55 |
20.40 - 22.00 |
0.5439 times |
Fri 25 July 2025 |
22.25 (-3.89%) |
24.15 |
21.05 - 24.15 |
3.0544 times |
Fri 18 July 2025 |
23.15 (3.58%) |
22.40 |
21.45 - 23.30 |
0.8787 times |
Monthly price and charts ManglamInfra Strong monthly Stock price targets for ManglamInfra MIEL_ST are 18.85 and 23.7 | Monthly Target 1 | 17.77 | | Monthly Target 2 | 19.93 | | Monthly Target 3 | 22.616666666667 | | Monthly Target 4 | 24.78 | | Monthly Target 5 | 27.47 |
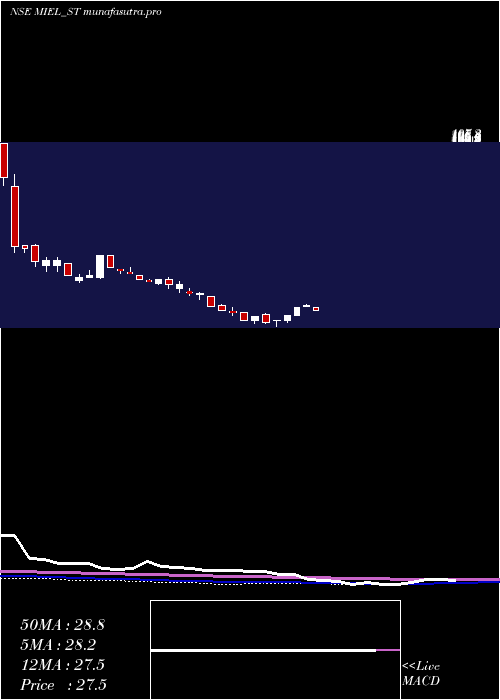
Monthly price and volumes Manglam Infra
| Date |
Closing |
Open |
Range |
Volume |
Tue 28 October 2025 |
22.10 (-5.96%) |
24.65 |
20.45 - 25.30 |
0.4183 times |
Mon 29 September 2025 |
23.50 (15.2%) |
29.40 |
23.50 - 29.40 |
0.3173 times |
Fri 01 August 2025 |
20.40 (-3.09%) |
20.50 |
20.40 - 21.30 |
0.024 times |
Wed 30 July 2025 |
21.05 (-6.03%) |
22.50 |
20.80 - 24.15 |
0.6683 times |
Mon 30 June 2025 |
22.40 (-20.14%) |
26.65 |
20.90 - 26.65 |
1.101 times |
Fri 30 May 2025 |
28.05 (0.18%) |
27.45 |
24.25 - 28.05 |
0.3894 times |
Wed 30 April 2025 |
28.00 (29.63%) |
22.65 |
20.00 - 30.35 |
1.024 times |
Fri 28 March 2025 |
21.60 (-21.88%) |
26.90 |
21.15 - 28.85 |
2.726 times |
Fri 28 February 2025 |
27.65 (-30.88%) |
36.25 |
27.65 - 38.00 |
2.3798 times |
Fri 31 January 2025 |
40.00 (-7.94%) |
43.00 |
36.10 - 43.65 |
0.9519 times |
Tue 31 December 2024 |
43.45 (-1.25%) |
43.10 |
43.00 - 53.60 |
1.0192 times |

DMA SMA EMA moving averages of Manglam Infra MIEL_ST
DMA (daily moving average) of Manglam Infra MIEL_ST
| DMA period | DMA value | | 5 day DMA | 21.76 | | 12 day DMA | 22 | | 20 day DMA | 22.89 | | 35 day DMA | 23.6 | | 50 day DMA | 23.25 | | 100 day DMA | 24.22 | | 150 day DMA | 25.77 | | 200 day DMA | 30.54 | EMA (exponential moving average) of Manglam Infra MIEL_ST
| EMA period | EMA current | EMA prev | EMA prev2 | | 5 day EMA | 21.74 | 21.56 | 21.81 | | 12 day EMA | 22.14 | 22.15 | 22.35 | | 20 day EMA | 22.58 | 22.63 | 22.8 | | 35 day EMA | 22.77 | 22.81 | 22.91 | | 50 day EMA | 23.03 | 23.07 | 23.15 |
SMA (simple moving average) of Manglam Infra MIEL_ST
| SMA period | SMA current | SMA prev | SMA prev2 | | 5 day SMA | 21.76 | 21.64 | 21.73 | | 12 day SMA | 22 | 22.03 | 22.23 | | 20 day SMA | 22.89 | 22.98 | 23.18 | | 35 day SMA | 23.6 | 23.63 | 23.66 | | 50 day SMA | 23.25 | 23.26 | 23.26 | | 100 day SMA | 24.22 | 24.25 | 24.27 | | 150 day SMA | 25.77 | 25.88 | 26 | | 200 day SMA | 30.54 | 30.69 | 30.84 |
|
|
