ManglamInfra MIEL_SM full analysis,charts,indicators,moving averages,SMA,DMA,EMA,ADX,MACD,RSIManglam Infra MIEL_SM WideScreen charts, DMA,SMA,EMA technical analysis, forecast prediction, by indicators ADX,MACD,RSI,CCI NSE stock exchange
Daily price and charts and targets ManglamInfra Strong Daily Stock price targets for ManglamInfra MIEL_SM are 20.45 and 20.55 | Daily Target 1 | 20.43 | | Daily Target 2 | 20.47 | | Daily Target 3 | 20.533333333333 | | Daily Target 4 | 20.57 | | Daily Target 5 | 20.63 |
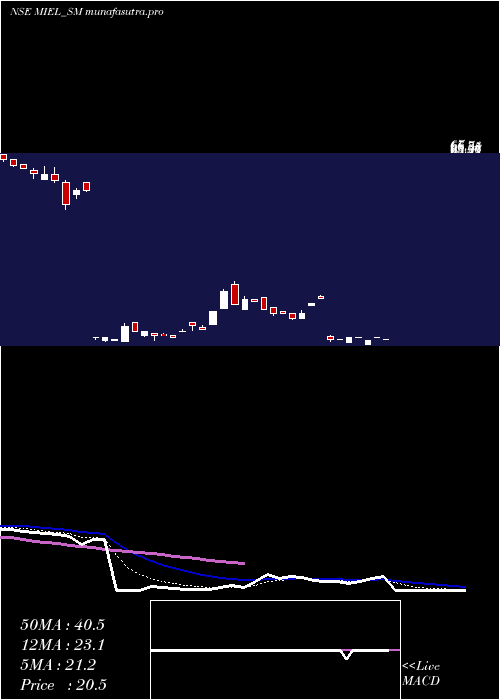
Daily price and volume Manglam Infra
| Date |
Closing |
Open |
Range |
Volume |
Wed 10 December 2025 |
20.50 (-2.38%) |
20.50 |
20.50 - 20.60 |
0.8 times |
Tue 09 December 2025 |
21.00 (2.94%) |
21.00 |
21.00 - 21.00 |
0.2 times |
Mon 08 December 2025 |
20.40 (-2.86%) |
19.40 |
19.40 - 20.40 |
0.4 times |
Fri 05 December 2025 |
21.00 (0%) |
21.00 |
21.00 - 21.00 |
0.4 times |
Thu 04 December 2025 |
21.00 (2.44%) |
19.85 |
19.80 - 21.00 |
1.6 times |
Wed 03 December 2025 |
20.50 (0%) |
20.50 |
20.50 - 20.50 |
1 times |
Tue 02 December 2025 |
20.50 (-33.76%) |
21.40 |
20.10 - 21.50 |
2 times |
Mon 08 September 2025 |
30.95 (4.21%) |
31.40 |
30.95 - 31.50 |
1 times |
Fri 05 September 2025 |
29.70 (10%) |
29.00 |
29.00 - 29.70 |
1 times |
Thu 04 September 2025 |
27.00 (4.25%) |
25.90 |
25.90 - 27.95 |
1.6 times |
Wed 03 September 2025 |
25.90 (-4.25%) |
27.05 |
25.55 - 27.05 |
2 times |
Weekly price and charts ManglamInfra Strong weekly Stock price targets for ManglamInfra MIEL_SM are 19.95 and 21.55 | Weekly Target 1 | 18.7 | | Weekly Target 2 | 19.6 | | Weekly Target 3 | 20.3 | | Weekly Target 4 | 21.2 | | Weekly Target 5 | 21.9 |
Weekly price and volumes for Manglam Infra
| Date |
Closing |
Open |
Range |
Volume |
Wed 10 December 2025 |
20.50 (-2.38%) |
19.40 |
19.40 - 21.00 |
0.0739 times |
Fri 05 December 2025 |
21.00 (-29.29%) |
31.40 |
19.80 - 31.50 |
0.3168 times |
Fri 05 September 2025 |
29.70 (5.69%) |
28.50 |
25.55 - 29.70 |
0.359 times |
Fri 29 August 2025 |
28.10 (-13.8%) |
34.35 |
28.00 - 35.00 |
0.9504 times |
Fri 22 August 2025 |
32.60 (54.5%) |
22.50 |
22.50 - 33.10 |
2.8617 times |
Thu 14 August 2025 |
21.10 (-6.22%) |
21.45 |
20.25 - 22.45 |
0.3485 times |
Fri 08 August 2025 |
22.50 (-61.11%) |
21.00 |
20.00 - 24.80 |
1.0771 times |
Wed 09 October 2024 |
57.85 (-4.38%) |
59.90 |
53.05 - 60.50 |
0.8553 times |
Fri 04 October 2024 |
60.50 (-5.84%) |
64.50 |
60.00 - 64.50 |
0.9504 times |
Fri 27 September 2024 |
64.25 (-6.2%) |
70.00 |
63.90 - 71.00 |
2.207 times |
Fri 20 September 2024 |
68.50 (1.18%) |
68.10 |
63.05 - 72.80 |
3.358 times |

Monthly price and charts ManglamInfra Strong monthly Stock price targets for ManglamInfra MIEL_SM are 18.9 and 21 | Monthly Target 1 | 18.37 | | Monthly Target 2 | 19.43 | | Monthly Target 3 | 20.466666666667 | | Monthly Target 4 | 21.53 | | Monthly Target 5 | 22.57 |
Monthly price and volumes Manglam Infra
| Date |
Closing |
Open |
Range |
Volume |
Wed 10 December 2025 |
20.50 (-33.76%) |
21.40 |
19.40 - 21.50 |
0.0537 times |
Mon 08 September 2025 |
30.95 (10.14%) |
28.50 |
25.55 - 31.50 |
0.0654 times |
Fri 29 August 2025 |
28.10 (-51.43%) |
21.00 |
20.00 - 35.00 |
0.8317 times |
Wed 09 October 2024 |
57.85 (-8.9%) |
63.05 |
53.05 - 63.95 |
0.2817 times |
Mon 30 September 2024 |
63.50 (-5.29%) |
68.00 |
63.05 - 76.00 |
2.5036 times |
Fri 30 August 2024 |
67.05 (0%) |
84.50 |
66.50 - 93.95 |
2.2638 times |
Wed 10 December 2025 |
(0%) |
|
- |
0 times |

DMA SMA EMA moving averages of Manglam Infra MIEL_SM
DMA (daily moving average) of Manglam Infra MIEL_SM
| DMA period | DMA value | | 5 day DMA | 20.78 | | 12 day DMA | 23.79 | | 20 day DMA | 25.7 | | 35 day DMA | 28.19 | | 50 day DMA | 39.53 | | 100 day DMA | | | 150 day DMA | | | 200 day DMA | | EMA (exponential moving average) of Manglam Infra MIEL_SM
| EMA period | EMA current | EMA prev | EMA prev2 | | 5 day EMA | 21.17 | 21.51 | 21.77 | | 12 day EMA | 23.14 | 23.62 | 24.1 | | 20 day EMA | 25.58 | 26.12 | 26.66 | | 35 day EMA | 33.25 | 34 | 34.77 | | 50 day EMA | 40.01 | 40.81 | 41.62 |
SMA (simple moving average) of Manglam Infra MIEL_SM
| SMA period | SMA current | SMA prev | SMA prev2 | | 5 day SMA | 20.78 | 20.78 | 20.68 | | 12 day SMA | 23.79 | 24.33 | 24.93 | | 20 day SMA | 25.7 | 25.88 | 25.95 | | 35 day SMA | 28.19 | 29.37 | 30.55 | | 50 day SMA | 39.53 | 40.46 | 41.4 | | 100 day SMA | | 150 day SMA | | 200 day SMA |
|
|
