MiraeamcMidsmall MIDSMALL full analysis,charts,indicators,moving averages,SMA,DMA,EMA,ADX,MACD,RSIMiraeamc Midsmall MIDSMALL WideScreen charts, DMA,SMA,EMA technical analysis, forecast prediction, by indicators ADX,MACD,RSI,CCI NSE stock exchange
Daily price and charts and targets MiraeamcMidsmall Strong Daily Stock price targets for MiraeamcMidsmall MIDSMALL are 48.89 and 49.39 | Daily Target 1 | 48.48 | | Daily Target 2 | 48.79 | | Daily Target 3 | 48.983333333333 | | Daily Target 4 | 49.29 | | Daily Target 5 | 49.48 |
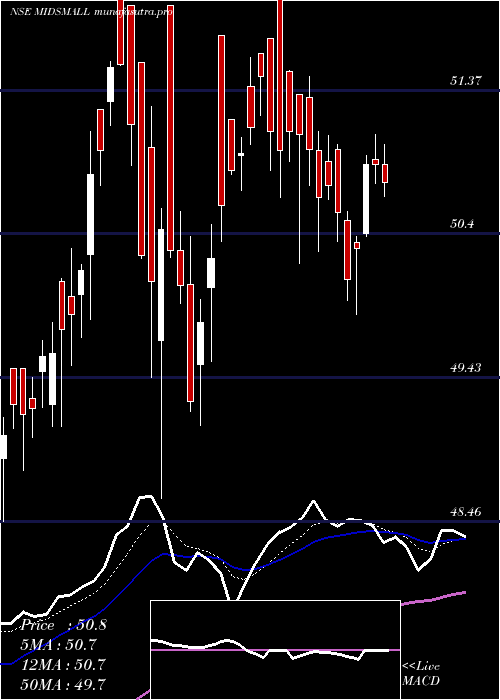
Daily price and volume Miraeamc Midsmall
| Date |
Closing |
Open |
Range |
Volume |
Wed 29 October 2025 |
49.09 (0.33%) |
48.93 |
48.68 - 49.18 |
0.805 times |
Tue 28 October 2025 |
48.93 (-0.12%) |
49.10 |
48.69 - 49.12 |
0.5561 times |
Mon 27 October 2025 |
48.99 (0.93%) |
48.78 |
48.75 - 49.06 |
1.0085 times |
Fri 24 October 2025 |
48.54 (-0.53%) |
48.80 |
48.44 - 49.09 |
0.8131 times |
Thu 23 October 2025 |
48.80 (-0.31%) |
49.50 |
48.50 - 49.79 |
0.8799 times |
Tue 21 October 2025 |
48.95 (0.25%) |
48.88 |
48.85 - 49.41 |
0.385 times |
Mon 20 October 2025 |
48.83 (0.45%) |
48.85 |
48.58 - 48.91 |
0.9376 times |
Fri 17 October 2025 |
48.61 (-0.41%) |
48.96 |
48.46 - 48.96 |
0.8028 times |
Thu 16 October 2025 |
48.81 (0.31%) |
48.66 |
48.58 - 48.87 |
2.0071 times |
Wed 15 October 2025 |
48.66 (1.23%) |
48.31 |
48.14 - 49.00 |
1.8049 times |
Tue 14 October 2025 |
48.07 (-1.11%) |
48.70 |
48.02 - 48.85 |
1.1194 times |
Weekly price and charts MiraeamcMidsmall Strong weekly Stock price targets for MiraeamcMidsmall MIDSMALL are 48.89 and 49.39 | Weekly Target 1 | 48.48 | | Weekly Target 2 | 48.79 | | Weekly Target 3 | 48.983333333333 | | Weekly Target 4 | 49.29 | | Weekly Target 5 | 49.48 |
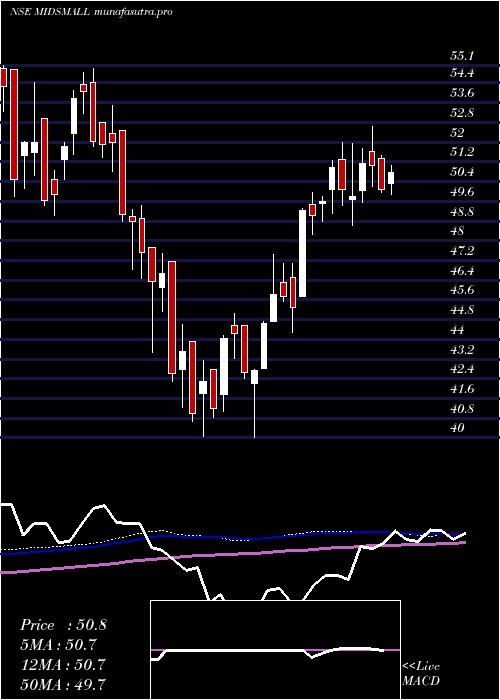
Weekly price and volumes for Miraeamc Midsmall
| Date |
Closing |
Open |
Range |
Volume |
Wed 29 October 2025 |
49.09 (1.13%) |
48.78 |
48.68 - 49.18 |
0.4039 times |
Fri 24 October 2025 |
48.54 (-0.14%) |
48.85 |
48.44 - 49.79 |
0.5141 times |
Fri 17 October 2025 |
48.61 (0.1%) |
48.41 |
48.02 - 49.00 |
1.1376 times |
Fri 10 October 2025 |
48.56 (1.36%) |
48.14 |
47.82 - 48.70 |
1.0704 times |
Fri 03 October 2025 |
47.91 (1.55%) |
46.99 |
46.66 - 47.97 |
1.009 times |
Fri 26 September 2025 |
47.18 (-5.17%) |
49.75 |
47.04 - 50.12 |
1.0478 times |
Fri 19 September 2025 |
49.75 (1.55%) |
49.24 |
48.90 - 50.00 |
1.0601 times |
Fri 12 September 2025 |
48.99 (2.21%) |
47.92 |
47.88 - 49.12 |
1.0205 times |
Fri 05 September 2025 |
47.93 (2.17%) |
46.91 |
46.91 - 49.58 |
1.2618 times |
Fri 29 August 2025 |
46.91 (-3.36%) |
48.78 |
46.80 - 48.93 |
1.4748 times |
Fri 22 August 2025 |
48.54 (1.63%) |
48.10 |
47.90 - 48.96 |
0.7303 times |
Monthly price and charts MiraeamcMidsmall Strong monthly Stock price targets for MiraeamcMidsmall MIDSMALL are 47.97 and 50.91 | Monthly Target 1 | 45.64 | | Monthly Target 2 | 47.36 | | Monthly Target 3 | 48.576666666667 | | Monthly Target 4 | 50.3 | | Monthly Target 5 | 51.52 |
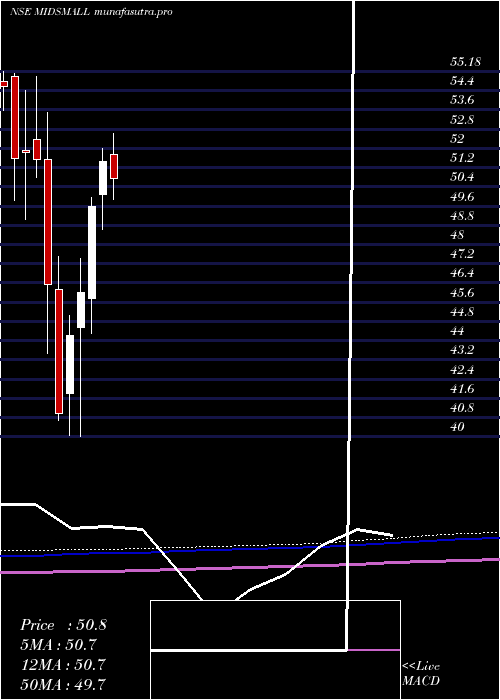
Monthly price and volumes Miraeamc Midsmall
| Date |
Closing |
Open |
Range |
Volume |
Wed 29 October 2025 |
49.09 (4.65%) |
47.18 |
46.85 - 49.79 |
0.6975 times |
Tue 30 September 2025 |
46.91 (0%) |
46.91 |
46.66 - 50.12 |
0.9911 times |
Fri 29 August 2025 |
46.91 (-3.91%) |
48.79 |
46.80 - 49.89 |
0.7423 times |
Thu 31 July 2025 |
48.82 (-5.13%) |
51.72 |
47.50 - 52.62 |
0.7826 times |
Mon 30 June 2025 |
51.46 (3.77%) |
50.08 |
48.61 - 51.99 |
1.1177 times |
Fri 30 May 2025 |
49.59 (7.83%) |
45.75 |
44.28 - 49.94 |
0.8802 times |
Wed 30 April 2025 |
45.99 (3.98%) |
44.55 |
40.00 - 47.43 |
0.9892 times |
Fri 28 March 2025 |
44.23 (7.9%) |
41.79 |
40.05 - 45.06 |
1.4733 times |
Fri 28 February 2025 |
40.99 (-11.53%) |
46.11 |
40.67 - 47.50 |
1.2205 times |
Fri 31 January 2025 |
46.33 (-10.07%) |
51.53 |
43.45 - 53.50 |
1.1057 times |
Tue 31 December 2024 |
51.52 (-0.6%) |
52.35 |
50.80 - 54.97 |
0.8644 times |
DMA SMA EMA moving averages of Miraeamc Midsmall MIDSMALL
DMA (daily moving average) of Miraeamc Midsmall MIDSMALL
| DMA period | DMA value | | 5 day DMA | 48.87 | | 12 day DMA | 48.74 | | 20 day DMA | 48.43 | | 35 day DMA | 48.58 | | 50 day DMA | 48.42 | | 100 day DMA | 49.18 | | 150 day DMA | 48.25 | | 200 day DMA | 47.4 | EMA (exponential moving average) of Miraeamc Midsmall MIDSMALL
| EMA period | EMA current | EMA prev | EMA prev2 | | 5 day EMA | 48.92 | 48.84 | 48.79 | | 12 day EMA | 48.74 | 48.68 | 48.64 | | 20 day EMA | 48.63 | 48.58 | 48.54 | | 35 day EMA | 48.49 | 48.45 | 48.42 | | 50 day EMA | 48.4 | 48.37 | 48.35 |
SMA (simple moving average) of Miraeamc Midsmall MIDSMALL
| SMA period | SMA current | SMA prev | SMA prev2 | | 5 day SMA | 48.87 | 48.84 | 48.82 | | 12 day SMA | 48.74 | 48.7 | 48.65 | | 20 day SMA | 48.43 | 48.34 | 48.25 | | 35 day SMA | 48.58 | 48.55 | 48.52 | | 50 day SMA | 48.42 | 48.39 | 48.37 | | 100 day SMA | 49.18 | 49.2 | 49.21 | | 150 day SMA | 48.25 | 48.21 | 48.17 | | 200 day SMA | 47.4 | 47.41 | 47.42 |
|
|
