NipInd MID150BEES full analysis,charts,indicators,moving averages,SMA,DMA,EMA,ADX,MACD,RSINip Ind MID150BEES WideScreen charts, DMA,SMA,EMA technical analysis, forecast prediction, by indicators ADX,MACD,RSI,CCI NSE stock exchange
Daily price and charts and targets NipInd Strong Daily Stock price targets for NipInd MID150BEES are 223.8 and 228.74 | Daily Target 1 | 222.57 | | Daily Target 2 | 225.02 | | Daily Target 3 | 227.50666666667 | | Daily Target 4 | 229.96 | | Daily Target 5 | 232.45 |
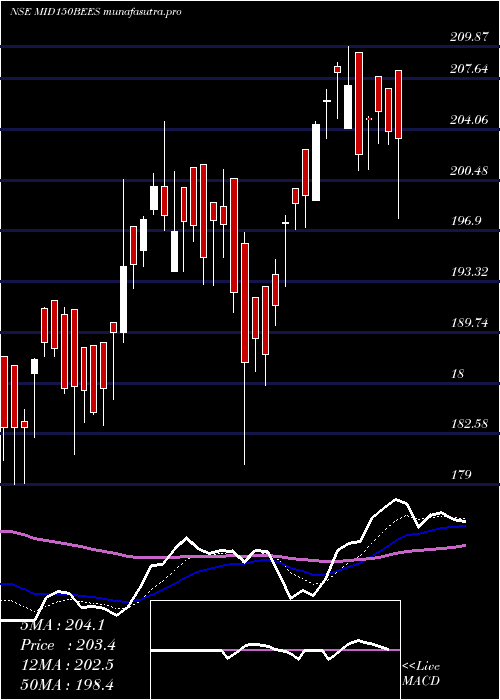
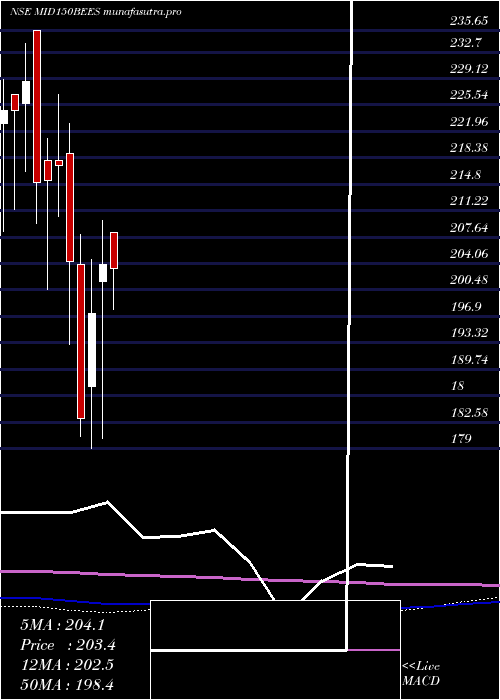
Daily price and volume Nip Ind
| Date |
Closing |
Open |
Range |
Volume |
Tue 28 October 2025 |
227.48 (-0.03%) |
229.99 |
225.05 - 229.99 |
0.7569 times |
Mon 27 October 2025 |
227.55 (0.89%) |
227.90 |
225.27 - 227.90 |
0.9063 times |
Fri 24 October 2025 |
225.55 (-0.26%) |
227.25 |
224.03 - 227.25 |
1.1998 times |
Thu 23 October 2025 |
226.13 (-0.07%) |
228.50 |
225.86 - 228.58 |
2.5512 times |
Tue 21 October 2025 |
226.28 (0.2%) |
226.79 |
225.51 - 227.51 |
0.3033 times |
Mon 20 October 2025 |
225.83 (0.68%) |
223.19 |
222.74 - 228.55 |
0.7736 times |
Fri 17 October 2025 |
224.31 (-0.71%) |
226.97 |
223.32 - 226.97 |
0.9442 times |
Thu 16 October 2025 |
225.92 (0.52%) |
226.90 |
224.55 - 226.90 |
0.5863 times |
Wed 15 October 2025 |
224.75 (1.57%) |
223.40 |
221.28 - 225.00 |
1.1979 times |
Tue 14 October 2025 |
221.27 (-1.02%) |
221.60 |
217.32 - 226.00 |
0.7805 times |
Mon 13 October 2025 |
223.56 (0.04%) |
224.99 |
222.14 - 224.99 |
0.7246 times |
Weekly price and charts NipInd Strong weekly Stock price targets for NipInd MID150BEES are 223.8 and 228.74 | Weekly Target 1 | 222.57 | | Weekly Target 2 | 225.02 | | Weekly Target 3 | 227.50666666667 | | Weekly Target 4 | 229.96 | | Weekly Target 5 | 232.45 |
Weekly price and volumes for Nip Ind
| Date |
Closing |
Open |
Range |
Volume |
Tue 28 October 2025 |
227.48 (0.86%) |
227.90 |
225.05 - 229.99 |
0.3699 times |
Fri 24 October 2025 |
225.55 (0.55%) |
223.19 |
222.74 - 228.58 |
1.0739 times |
Fri 17 October 2025 |
224.31 (0.37%) |
224.99 |
217.32 - 226.97 |
0.9416 times |
Fri 10 October 2025 |
223.48 (1.25%) |
223.99 |
218.60 - 224.80 |
1.2981 times |
Fri 03 October 2025 |
220.73 (1.98%) |
218.60 |
214.70 - 224.04 |
0.7974 times |
Fri 26 September 2025 |
216.44 (-4.22%) |
227.90 |
216.11 - 227.90 |
1.3919 times |
Fri 19 September 2025 |
225.97 (1.63%) |
224.60 |
221.04 - 235.00 |
1.2331 times |
Fri 12 September 2025 |
222.34 (2.04%) |
216.20 |
216.20 - 223.70 |
0.8032 times |
Fri 05 September 2025 |
217.90 (2.06%) |
215.90 |
213.50 - 222.00 |
0.8859 times |
Fri 29 August 2025 |
213.50 (-3.54%) |
223.34 |
213.27 - 223.99 |
1.2051 times |
Fri 22 August 2025 |
221.34 (2.1%) |
210.28 |
210.28 - 224.20 |
0.9781 times |

Monthly price and charts NipInd Strong monthly Stock price targets for NipInd MID150BEES are 221.79 and 235.68 | Monthly Target 1 | 210.63 | | Monthly Target 2 | 219.06 | | Monthly Target 3 | 224.52333333333 | | Monthly Target 4 | 232.95 | | Monthly Target 5 | 238.41 |
Monthly price and volumes Nip Ind
| Date |
Closing |
Open |
Range |
Volume |
Tue 28 October 2025 |
227.48 (4.58%) |
224.04 |
216.10 - 229.99 |
0.8013 times |
Tue 30 September 2025 |
217.51 (1.88%) |
215.90 |
213.50 - 235.00 |
0.8695 times |
Fri 29 August 2025 |
213.50 (-3.03%) |
222.99 |
210.28 - 224.20 |
0.7146 times |
Thu 31 July 2025 |
220.16 (-2.49%) |
228.60 |
214.91 - 228.90 |
0.923 times |
Mon 30 June 2025 |
225.79 (3.76%) |
221.60 |
215.33 - 227.99 |
1.0421 times |
Fri 30 May 2025 |
217.61 (6.71%) |
208.20 |
195.01 - 219.99 |
1.0943 times |
Wed 30 April 2025 |
203.92 (3.36%) |
201.60 |
180.39 - 209.87 |
1.1733 times |
Fri 28 March 2025 |
197.30 (7.8%) |
187.40 |
179.00 - 204.60 |
0.8422 times |
Fri 28 February 2025 |
183.02 (-10.45%) |
203.99 |
180.68 - 207.97 |
1.5636 times |
Fri 31 January 2025 |
204.38 (-6%) |
218.99 |
193.12 - 222.97 |
0.9759 times |
Tue 31 December 2024 |
217.42 (0.98%) |
217.99 |
210.50 - 226.99 |
0.441 times |
DMA SMA EMA moving averages of Nip Ind MID150BEES
DMA (daily moving average) of Nip Ind MID150BEES
| DMA period | DMA value | | 5 day DMA | 226.6 | | 12 day DMA | 225.18 | | 20 day DMA | 223.24 | | 35 day DMA | 222.91 | | 50 day DMA | 221.68 | | 100 day DMA | 222.04 | | 150 day DMA | 216.35 | | 200 day DMA | 211.44 | EMA (exponential moving average) of Nip Ind MID150BEES
| EMA period | EMA current | EMA prev | EMA prev2 | | 5 day EMA | 226.63 | 226.2 | 225.53 | | 12 day EMA | 225.31 | 224.91 | 224.43 | | 20 day EMA | 224.26 | 223.92 | 223.54 | | 35 day EMA | 222.83 | 222.56 | 222.27 | | 50 day EMA | 221.75 | 221.52 | 221.27 |
SMA (simple moving average) of Nip Ind MID150BEES
| SMA period | SMA current | SMA prev | SMA prev2 | | 5 day SMA | 226.6 | 226.27 | 225.62 | | 12 day SMA | 225.18 | 224.79 | 224.23 | | 20 day SMA | 223.24 | 222.69 | 222.34 | | 35 day SMA | 222.91 | 222.63 | 222.36 | | 50 day SMA | 221.68 | 221.48 | 221.25 | | 100 day SMA | 222.04 | 221.96 | 221.86 | | 150 day SMA | 216.35 | 216.13 | 215.88 | | 200 day SMA | 211.44 | 211.38 | 211.35 |
|
|
