MahalaxmiRubtech MHLXMIRU full analysis,charts,indicators,moving averages,SMA,DMA,EMA,ADX,MACD,RSIMahalaxmi Rubtech MHLXMIRU WideScreen charts, DMA,SMA,EMA technical analysis, forecast prediction, by indicators ADX,MACD,RSI,CCI NSE stock exchange
Daily price and charts and targets MahalaxmiRubtech Strong Daily Stock price targets for MahalaxmiRubtech MHLXMIRU are 204.04 and 213.28 | Daily Target 1 | 202.36 | | Daily Target 2 | 205.72 | | Daily Target 3 | 211.60333333333 | | Daily Target 4 | 214.96 | | Daily Target 5 | 220.84 |
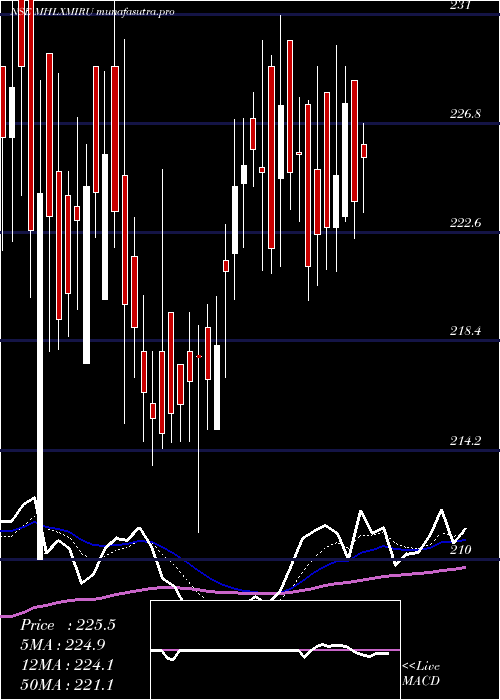
Daily price and volume Mahalaxmi Rubtech
| Date |
Closing |
Open |
Range |
Volume |
Wed 29 October 2025 |
209.07 (-1.77%) |
217.49 |
208.25 - 217.49 |
1.6441 times |
Tue 28 October 2025 |
212.84 (0.4%) |
210.94 |
209.11 - 217.50 |
1.1246 times |
Mon 27 October 2025 |
211.99 (2.14%) |
207.60 |
207.60 - 214.95 |
1.0025 times |
Fri 24 October 2025 |
207.55 (-2.78%) |
214.00 |
206.51 - 214.98 |
1.0914 times |
Thu 23 October 2025 |
213.49 (-0.56%) |
217.80 |
210.01 - 217.80 |
0.4455 times |
Tue 21 October 2025 |
214.70 (1.91%) |
215.63 |
211.75 - 215.64 |
0.2196 times |
Mon 20 October 2025 |
210.67 (-0.5%) |
208.12 |
205.00 - 214.99 |
0.4394 times |
Fri 17 October 2025 |
211.72 (-1.01%) |
218.89 |
211.01 - 218.89 |
0.8191 times |
Thu 16 October 2025 |
213.87 (3.29%) |
213.77 |
208.06 - 214.92 |
1.451 times |
Wed 15 October 2025 |
207.06 (-1.31%) |
219.94 |
205.27 - 219.94 |
1.7628 times |
Tue 14 October 2025 |
209.80 (-4.22%) |
219.05 |
208.00 - 220.00 |
7.5264 times |
Weekly price and charts MahalaxmiRubtech Strong weekly Stock price targets for MahalaxmiRubtech MHLXMIRU are 208.34 and 218.24 | Weekly Target 1 | 201.49 | | Weekly Target 2 | 205.28 | | Weekly Target 3 | 211.39 | | Weekly Target 4 | 215.18 | | Weekly Target 5 | 221.29 |
Weekly price and volumes for Mahalaxmi Rubtech
| Date |
Closing |
Open |
Range |
Volume |
Wed 29 October 2025 |
209.07 (0.73%) |
207.60 |
207.60 - 217.50 |
0.7027 times |
Fri 24 October 2025 |
207.55 (-1.97%) |
208.12 |
205.00 - 217.80 |
0.4092 times |
Fri 17 October 2025 |
211.72 (-3.48%) |
216.25 |
205.27 - 223.95 |
2.2374 times |
Fri 10 October 2025 |
219.36 (1.01%) |
218.25 |
212.00 - 226.00 |
1.0711 times |
Fri 03 October 2025 |
217.17 (-0.39%) |
219.00 |
216.10 - 221.29 |
0.9075 times |
Fri 26 September 2025 |
218.02 (-2.05%) |
221.51 |
216.30 - 227.49 |
0.3202 times |
Fri 19 September 2025 |
222.59 (0.54%) |
221.41 |
216.21 - 224.99 |
0.9781 times |
Fri 12 September 2025 |
221.40 (0.87%) |
219.00 |
216.31 - 226.10 |
1.1364 times |
Fri 05 September 2025 |
219.49 (3.26%) |
211.50 |
210.03 - 227.99 |
1.0114 times |
Fri 29 August 2025 |
212.56 (-3.91%) |
221.20 |
206.40 - 224.48 |
1.226 times |
Fri 22 August 2025 |
221.21 (-3.37%) |
224.34 |
218.15 - 231.38 |
1.8898 times |
Monthly price and charts MahalaxmiRubtech Strong monthly Stock price targets for MahalaxmiRubtech MHLXMIRU are 196.54 and 217.54 | Monthly Target 1 | 192.36 | | Monthly Target 2 | 200.71 | | Monthly Target 3 | 213.35666666667 | | Monthly Target 4 | 221.71 | | Monthly Target 5 | 234.36 |
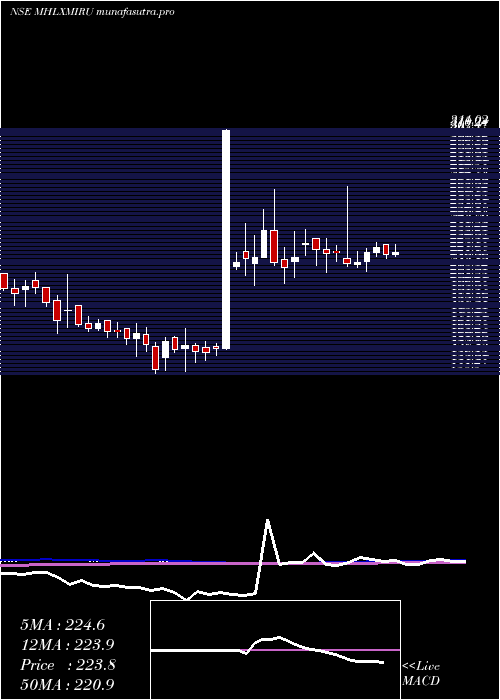
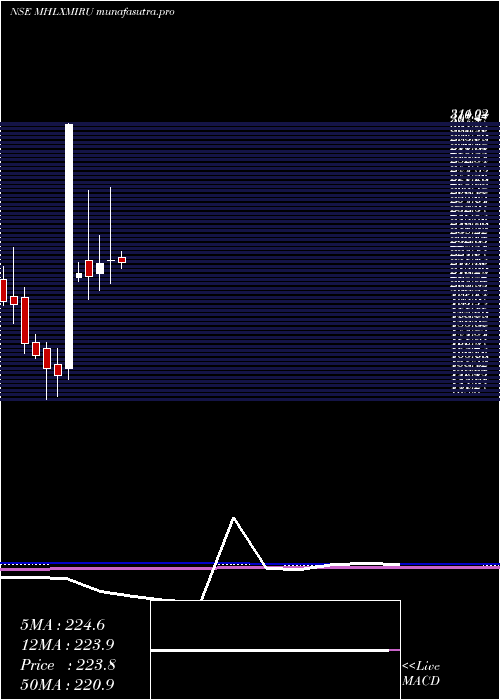
Monthly price and volumes Mahalaxmi Rubtech
| Date |
Closing |
Open |
Range |
Volume |
Wed 29 October 2025 |
209.07 (-4.67%) |
218.32 |
205.00 - 226.00 |
0.07 times |
Tue 30 September 2025 |
219.32 (3.18%) |
211.50 |
210.03 - 227.99 |
0.0644 times |
Fri 29 August 2025 |
212.56 (-2.2%) |
220.29 |
206.40 - 236.49 |
0.0964 times |
Thu 31 July 2025 |
217.35 (-3.46%) |
227.00 |
215.01 - 230.95 |
0.1742 times |
Mon 30 June 2025 |
225.15 (0.86%) |
224.95 |
211.01 - 270.68 |
0.5799 times |
Fri 30 May 2025 |
223.23 (3.82%) |
217.00 |
206.55 - 240.80 |
0.4691 times |
Wed 30 April 2025 |
215.01 (-0.8%) |
224.90 |
201.00 - 269.04 |
0.2463 times |
Fri 28 March 2025 |
216.75 (-30.15%) |
214.51 |
212.04 - 223.90 |
0.0108 times |
Fri 13 December 2024 |
310.29 (102.51%) |
157.86 |
151.00 - 311.02 |
7.7831 times |
Fri 29 November 2024 |
153.22 (-2.71%) |
159.99 |
140.00 - 170.00 |
0.5058 times |
Thu 31 October 2024 |
157.49 (-5.1%) |
170.00 |
138.50 - 173.99 |
0.1904 times |
DMA SMA EMA moving averages of Mahalaxmi Rubtech MHLXMIRU
DMA (daily moving average) of Mahalaxmi Rubtech MHLXMIRU
| DMA period | DMA value | | 5 day DMA | 210.99 | | 12 day DMA | 211.82 | | 20 day DMA | 214.39 | | 35 day DMA | 216.75 | | 50 day DMA | 217.8 | | 100 day DMA | 219.42 | | 150 day DMA | 222.5 | | 200 day DMA | 206.89 | EMA (exponential moving average) of Mahalaxmi Rubtech MHLXMIRU
| EMA period | EMA current | EMA prev | EMA prev2 | | 5 day EMA | 210.99 | 211.95 | 211.5 | | 12 day EMA | 212.38 | 212.98 | 213.01 | | 20 day EMA | 213.81 | 214.31 | 214.47 | | 35 day EMA | 215.61 | 215.99 | 216.18 | | 50 day EMA | 217.37 | 217.71 | 217.91 |
SMA (simple moving average) of Mahalaxmi Rubtech MHLXMIRU
| SMA period | SMA current | SMA prev | SMA prev2 | | 5 day SMA | 210.99 | 212.11 | 211.68 | | 12 day SMA | 211.82 | 212.68 | 213.28 | | 20 day SMA | 214.39 | 214.88 | 215.14 | | 35 day SMA | 216.75 | 216.97 | 217.16 | | 50 day SMA | 217.8 | 218.19 | 218.45 | | 100 day SMA | 219.42 | 219.57 | 219.67 | | 150 day SMA | 222.5 | 222.82 | 222.83 | | 200 day SMA | 206.89 | 206.69 | 206.46 |
|
|
