MangalamGlobal MGEL full analysis,charts,indicators,moving averages,SMA,DMA,EMA,ADX,MACD,RSIMangalam Global MGEL WideScreen charts, DMA,SMA,EMA technical analysis, forecast prediction, by indicators ADX,MACD,RSI,CCI NSE stock exchange
Daily price and charts and targets MangalamGlobal Strong Daily Stock price targets for MangalamGlobal MGEL are 14.56 and 15.1 | Daily Target 1 | 14.44 | | Daily Target 2 | 14.67 | | Daily Target 3 | 14.98 | | Daily Target 4 | 15.21 | | Daily Target 5 | 15.52 |
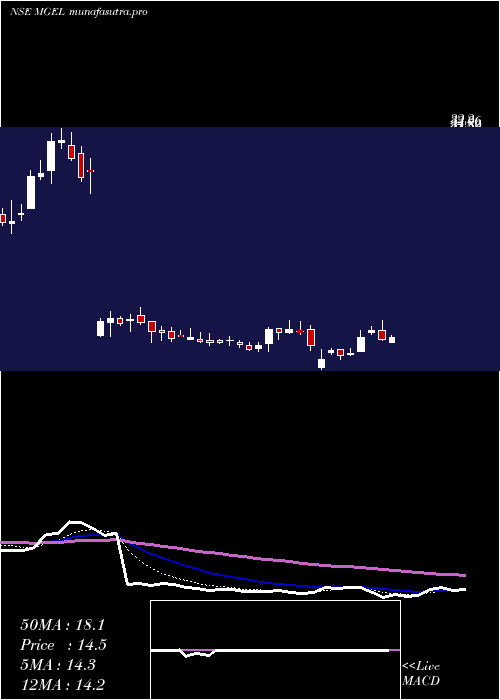
Daily price and volume Mangalam Global
| Date |
Closing |
Open |
Range |
Volume |
Tue 28 October 2025 |
14.90 (-1.06%) |
15.06 |
14.75 - 15.29 |
0.1574 times |
Mon 27 October 2025 |
15.06 (0.4%) |
15.07 |
14.87 - 15.40 |
0.2117 times |
Fri 24 October 2025 |
15.00 (-1.06%) |
15.20 |
14.70 - 15.43 |
0.2204 times |
Thu 23 October 2025 |
15.16 (-2.19%) |
15.75 |
15.05 - 15.75 |
0.2559 times |
Tue 21 October 2025 |
15.50 (-0.13%) |
15.52 |
15.37 - 15.76 |
0.0975 times |
Mon 20 October 2025 |
15.52 (2.78%) |
15.22 |
15.10 - 15.80 |
0.4973 times |
Fri 17 October 2025 |
15.10 (-1.44%) |
15.45 |
15.02 - 15.58 |
0.4263 times |
Thu 16 October 2025 |
15.32 (-0.84%) |
15.77 |
15.20 - 16.00 |
1.4262 times |
Wed 15 October 2025 |
15.45 (-8.53%) |
17.00 |
15.11 - 17.00 |
6.5864 times |
Tue 14 October 2025 |
16.89 (1.2%) |
16.90 |
16.50 - 17.09 |
0.1208 times |
Mon 13 October 2025 |
16.69 (-1.13%) |
16.70 |
16.55 - 17.19 |
0.1822 times |
Weekly price and charts MangalamGlobal Strong weekly Stock price targets for MangalamGlobal MGEL are 14.5 and 15.15 | Weekly Target 1 | 14.37 | | Weekly Target 2 | 14.63 | | Weekly Target 3 | 15.016666666667 | | Weekly Target 4 | 15.28 | | Weekly Target 5 | 15.67 |
Weekly price and volumes for Mangalam Global
| Date |
Closing |
Open |
Range |
Volume |
Tue 28 October 2025 |
14.90 (-0.67%) |
15.07 |
14.75 - 15.40 |
0.1095 times |
Fri 24 October 2025 |
15.00 (-0.66%) |
15.22 |
14.70 - 15.80 |
0.3178 times |
Fri 17 October 2025 |
15.10 (-10.55%) |
16.70 |
15.02 - 17.19 |
2.5939 times |
Fri 10 October 2025 |
16.88 (-6.17%) |
18.00 |
16.60 - 18.17 |
0.5227 times |
Fri 03 October 2025 |
17.99 (4.41%) |
17.37 |
15.80 - 18.10 |
2.5628 times |
Fri 26 September 2025 |
17.23 (10.88%) |
15.48 |
15.37 - 18.40 |
1.9194 times |
Fri 19 September 2025 |
15.54 (2.98%) |
15.09 |
14.92 - 16.70 |
0.7022 times |
Fri 12 September 2025 |
15.09 (-0.07%) |
15.11 |
14.86 - 16.20 |
0.3545 times |
Fri 05 September 2025 |
15.10 (-7.65%) |
16.26 |
14.36 - 16.35 |
0.2719 times |
Fri 29 August 2025 |
16.35 (2.7%) |
15.81 |
14.82 - 16.50 |
0.6453 times |
Fri 22 August 2025 |
15.92 (-2.99%) |
16.65 |
15.60 - 16.80 |
0.3908 times |

Monthly price and charts MangalamGlobal Strong monthly Stock price targets for MangalamGlobal MGEL are 13.07 and 16.54 | Monthly Target 1 | 12.45 | | Monthly Target 2 | 13.68 | | Monthly Target 3 | 15.923333333333 | | Monthly Target 4 | 17.15 | | Monthly Target 5 | 19.39 |
Monthly price and volumes Mangalam Global
| Date |
Closing |
Open |
Range |
Volume |
Tue 28 October 2025 |
14.90 (-6.35%) |
15.95 |
14.70 - 18.17 |
1.3813 times |
Tue 30 September 2025 |
15.91 (-2.69%) |
16.26 |
14.36 - 18.40 |
1.5414 times |
Fri 29 August 2025 |
16.35 (-6.46%) |
17.70 |
14.82 - 18.10 |
0.5877 times |
Thu 31 July 2025 |
17.48 (18.43%) |
14.90 |
14.50 - 18.15 |
2.3223 times |
Mon 30 June 2025 |
14.76 (12.59%) |
13.10 |
11.98 - 15.31 |
1.5978 times |
Fri 30 May 2025 |
13.11 (1.71%) |
12.89 |
11.77 - 13.88 |
0.3204 times |
Wed 30 April 2025 |
12.89 (-14.86%) |
15.18 |
11.70 - 15.90 |
0.6503 times |
Fri 28 March 2025 |
15.14 (-46.06%) |
28.64 |
13.21 - 29.67 |
0.5465 times |
Fri 28 February 2025 |
28.07 (16.72%) |
26.00 |
23.24 - 32.20 |
0.3619 times |
Fri 31 January 2025 |
24.05 (-15.64%) |
28.35 |
23.49 - 33.48 |
0.6904 times |
Tue 31 December 2024 |
28.51 (17.66%) |
24.69 |
22.42 - 28.95 |
0.277 times |

DMA SMA EMA moving averages of Mangalam Global MGEL
DMA (daily moving average) of Mangalam Global MGEL
| DMA period | DMA value | | 5 day DMA | 15.12 | | 12 day DMA | 15.62 | | 20 day DMA | 16.16 | | 35 day DMA | 16.1 | | 50 day DMA | 16.07 | | 100 day DMA | 15.84 | | 150 day DMA | 15.04 | | 200 day DMA | 17.44 | EMA (exponential moving average) of Mangalam Global MGEL
| EMA period | EMA current | EMA prev | EMA prev2 | | 5 day EMA | 15.12 | 15.23 | 15.31 | | 12 day EMA | 15.53 | 15.64 | 15.75 | | 20 day EMA | 15.8 | 15.89 | 15.98 | | 35 day EMA | 15.96 | 16.02 | 16.08 | | 50 day EMA | 16 | 16.04 | 16.08 |
SMA (simple moving average) of Mangalam Global MGEL
| SMA period | SMA current | SMA prev | SMA prev2 | | 5 day SMA | 15.12 | 15.25 | 15.26 | | 12 day SMA | 15.62 | 15.78 | 15.95 | | 20 day SMA | 16.16 | 16.28 | 16.42 | | 35 day SMA | 16.1 | 16.11 | 16.13 | | 50 day SMA | 16.07 | 16.1 | 16.12 | | 100 day SMA | 15.84 | 15.81 | 15.78 | | 150 day SMA | 15.04 | 15.04 | 15.03 | | 200 day SMA | 17.44 | 17.51 | 17.58 |
|
|
