MetroBrands METROBRAND full analysis,charts,indicators,moving averages,SMA,DMA,EMA,ADX,MACD,RSIMetro Brands METROBRAND WideScreen charts, DMA,SMA,EMA technical analysis, forecast prediction, by indicators ADX,MACD,RSI,CCI NSE stock exchange
Daily price and charts and targets MetroBrands Strong Daily Stock price targets for MetroBrands METROBRAND are 1115.15 and 1167.65 | Daily Target 1 | 1105 | | Daily Target 2 | 1125.3 | | Daily Target 3 | 1157.5 | | Daily Target 4 | 1177.8 | | Daily Target 5 | 1210 |
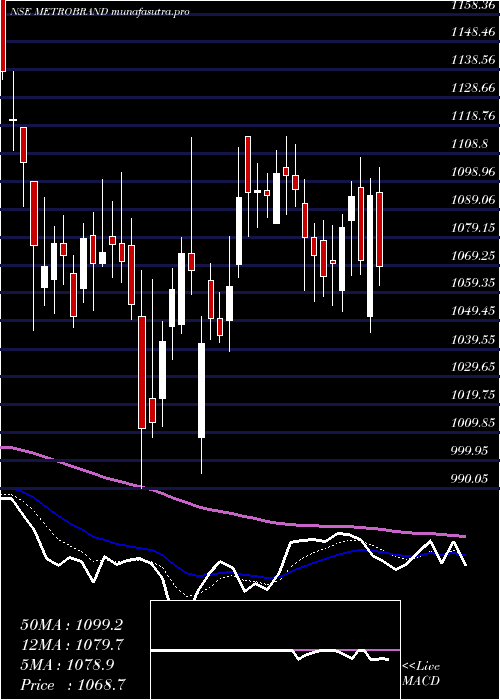
Daily price and volume Metro Brands
| Date |
Closing |
Open |
Range |
Volume |
Tue 28 October 2025 |
1145.60 (-2.71%) |
1189.70 |
1137.20 - 1189.70 |
0.9413 times |
Mon 27 October 2025 |
1177.50 (3.62%) |
1145.00 |
1136.80 - 1215.00 |
1.6901 times |
Fri 24 October 2025 |
1136.40 (-1.04%) |
1158.60 |
1117.70 - 1158.60 |
2.5758 times |
Thu 23 October 2025 |
1148.40 (-0.99%) |
1171.90 |
1136.00 - 1173.90 |
0.6046 times |
Tue 21 October 2025 |
1159.90 (0.42%) |
1135.00 |
1135.00 - 1165.00 |
0.1489 times |
Mon 20 October 2025 |
1155.00 (-4.01%) |
1203.30 |
1152.20 - 1203.30 |
1.7271 times |
Fri 17 October 2025 |
1203.30 (-0.55%) |
1198.90 |
1162.70 - 1250.00 |
1.0918 times |
Thu 16 October 2025 |
1209.90 (0.14%) |
1208.20 |
1201.00 - 1218.40 |
0.4983 times |
Wed 15 October 2025 |
1208.20 (1.73%) |
1189.10 |
1187.70 - 1212.90 |
0.3134 times |
Tue 14 October 2025 |
1187.70 (-2.61%) |
1225.80 |
1182.50 - 1225.80 |
0.4087 times |
Mon 13 October 2025 |
1219.50 (-0.07%) |
1221.00 |
1206.80 - 1224.70 |
0.2353 times |
Weekly price and charts MetroBrands Strong weekly Stock price targets for MetroBrands METROBRAND are 1141.2 and 1219.4 | Weekly Target 1 | 1087.6 | | Weekly Target 2 | 1116.6 | | Weekly Target 3 | 1165.8 | | Weekly Target 4 | 1194.8 | | Weekly Target 5 | 1244 |
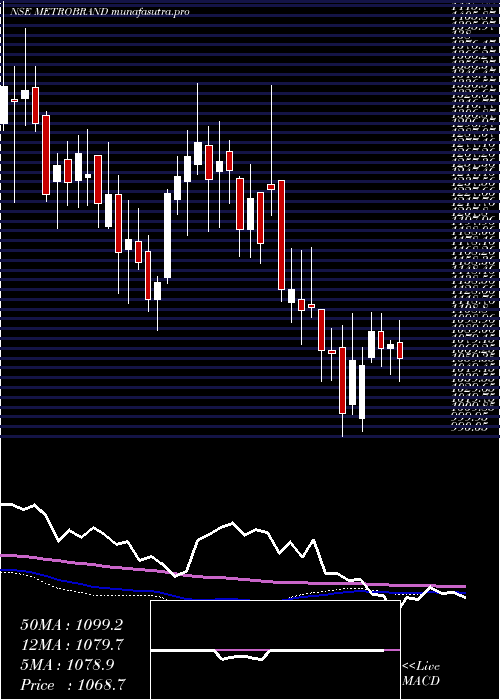
Weekly price and volumes for Metro Brands
| Date |
Closing |
Open |
Range |
Volume |
Tue 28 October 2025 |
1145.60 (0.81%) |
1145.00 |
1136.80 - 1215.00 |
0.4872 times |
Fri 24 October 2025 |
1136.40 (-5.56%) |
1203.30 |
1117.70 - 1203.30 |
0.9361 times |
Fri 17 October 2025 |
1203.30 (-1.39%) |
1221.00 |
1162.70 - 1250.00 |
0.4716 times |
Fri 10 October 2025 |
1220.30 (-2.66%) |
1252.50 |
1204.80 - 1283.00 |
0.5023 times |
Fri 03 October 2025 |
1253.60 (2.84%) |
1259.90 |
1200.00 - 1308.80 |
1.0139 times |
Fri 26 September 2025 |
1219.00 (-7.02%) |
1306.90 |
1214.00 - 1308.10 |
1.6904 times |
Fri 19 September 2025 |
1311.10 (1.79%) |
1285.00 |
1244.70 - 1340.40 |
1.2454 times |
Fri 12 September 2025 |
1288.00 (4.54%) |
1226.00 |
1184.70 - 1299.90 |
1.7846 times |
Fri 05 September 2025 |
1232.10 (8%) |
1149.90 |
1134.90 - 1250.00 |
1.5109 times |
Fri 29 August 2025 |
1140.80 (-1.61%) |
1165.60 |
1125.00 - 1168.00 |
0.3575 times |
Fri 22 August 2025 |
1159.50 (5.36%) |
1140.00 |
1124.90 - 1170.90 |
0.6658 times |
Monthly price and charts MetroBrands Strong monthly Stock price targets for MetroBrands METROBRAND are 1036.1 and 1227.2 | Monthly Target 1 | 999.6 | | Monthly Target 2 | 1072.6 | | Monthly Target 3 | 1190.7 | | Monthly Target 4 | 1263.7 | | Monthly Target 5 | 1381.8 |
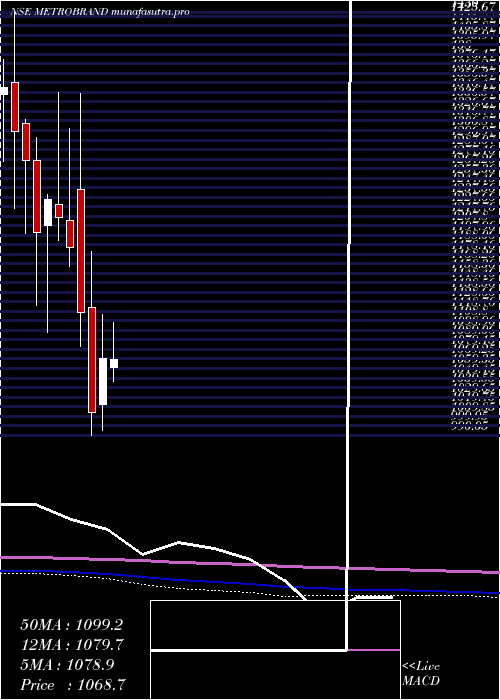
Monthly price and volumes Metro Brands
| Date |
Closing |
Open |
Range |
Volume |
Tue 28 October 2025 |
1145.60 (-11.21%) |
1288.00 |
1117.70 - 1308.80 |
0.5473 times |
Tue 30 September 2025 |
1290.30 (13.1%) |
1149.90 |
1134.90 - 1340.40 |
1.2824 times |
Fri 29 August 2025 |
1140.80 (-8.27%) |
1256.00 |
1090.90 - 1256.00 |
0.6311 times |
Thu 31 July 2025 |
1243.60 (8.12%) |
1150.20 |
1126.30 - 1304.50 |
1.3839 times |
Mon 30 June 2025 |
1150.20 (-4.68%) |
1206.70 |
1125.20 - 1288.00 |
1.2005 times |
Fri 30 May 2025 |
1206.70 (12.78%) |
1060.30 |
1020.00 - 1299.60 |
0.9679 times |
Wed 30 April 2025 |
1070.00 (5.6%) |
1022.00 |
995.25 - 1115.00 |
0.4423 times |
Fri 28 March 2025 |
1013.30 (-9.3%) |
1122.95 |
990.05 - 1181.00 |
1.0198 times |
Fri 28 February 2025 |
1117.15 (-5.71%) |
1245.00 |
1082.70 - 1345.00 |
1.3758 times |
Fri 31 January 2025 |
1184.85 (-2.63%) |
1213.25 |
1165.00 - 1308.75 |
1.1489 times |
Tue 31 December 2024 |
1216.85 (-1.51%) |
1229.85 |
1192.80 - 1346.50 |
1.524 times |
DMA SMA EMA moving averages of Metro Brands METROBRAND
DMA (daily moving average) of Metro Brands METROBRAND
| DMA period | DMA value | | 5 day DMA | 1153.56 | | 12 day DMA | 1180.98 | | 20 day DMA | 1209.96 | | 35 day DMA | 1235.54 | | 50 day DMA | 1212.74 | | 100 day DMA | 1197.3 | | 150 day DMA | 1168.58 | | 200 day DMA | 1171.2 | EMA (exponential moving average) of Metro Brands METROBRAND
| EMA period | EMA current | EMA prev | EMA prev2 | | 5 day EMA | 1158.56 | 1165.04 | 1158.81 | | 12 day EMA | 1179.52 | 1185.68 | 1187.17 | | 20 day EMA | 1195.43 | 1200.67 | 1203.11 | | 35 day EMA | 1198.23 | 1201.33 | 1202.73 | | 50 day EMA | 1199.28 | 1201.47 | 1202.45 |
SMA (simple moving average) of Metro Brands METROBRAND
| SMA period | SMA current | SMA prev | SMA prev2 | | 5 day SMA | 1153.56 | 1155.44 | 1160.6 | | 12 day SMA | 1180.98 | 1186.99 | 1193.71 | | 20 day SMA | 1209.96 | 1213.63 | 1217.59 | | 35 day SMA | 1235.54 | 1238.01 | 1239.42 | | 50 day SMA | 1212.74 | 1212.11 | 1211.1 | | 100 day SMA | 1197.3 | 1198.19 | 1198.46 | | 150 day SMA | 1168.58 | 1168.14 | 1167.29 | | 200 day SMA | 1171.2 | 1171.69 | 1172.14 |
|
|
