MiraeamcMetal METAL full analysis,charts,indicators,moving averages,SMA,DMA,EMA,ADX,MACD,RSIMiraeamc Metal METAL WideScreen charts, DMA,SMA,EMA technical analysis, forecast prediction, by indicators ADX,MACD,RSI,CCI NSE stock exchange
Daily price and charts and targets MiraeamcMetal Strong Daily Stock price targets for MiraeamcMetal METAL are 10.75 and 10.99 | Daily Target 1 | 10.56 | | Daily Target 2 | 10.69 | | Daily Target 3 | 10.796666666667 | | Daily Target 4 | 10.93 | | Daily Target 5 | 11.04 |
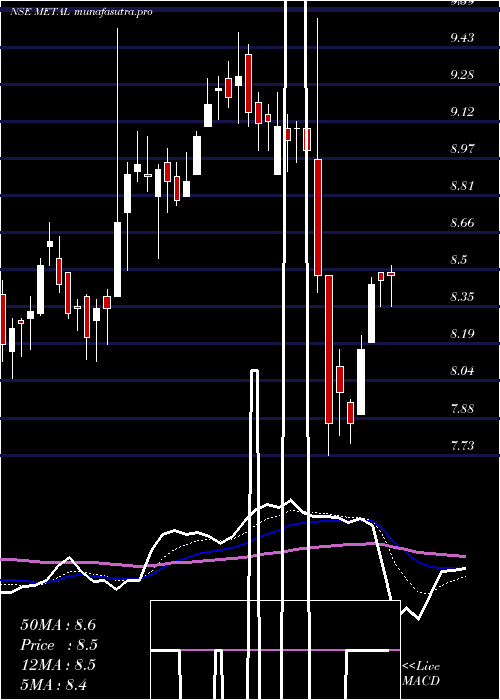
Daily price and volume Miraeamc Metal
| Date |
Closing |
Open |
Range |
Volume |
Wed 29 October 2025 |
10.83 (1.69%) |
10.70 |
10.66 - 10.90 |
1.5855 times |
Tue 28 October 2025 |
10.65 (1.24%) |
10.58 |
10.49 - 10.69 |
1.0591 times |
Mon 27 October 2025 |
10.52 (1.25%) |
10.60 |
10.40 - 10.70 |
2.0811 times |
Fri 24 October 2025 |
10.39 (0.97%) |
10.54 |
10.03 - 10.54 |
0.985 times |
Thu 23 October 2025 |
10.29 (0%) |
10.54 |
10.25 - 10.54 |
1.1052 times |
Tue 21 October 2025 |
10.29 (0.59%) |
10.48 |
10.27 - 10.48 |
0.4274 times |
Mon 20 October 2025 |
10.23 (-0.1%) |
10.27 |
10.18 - 10.38 |
0.5999 times |
Fri 17 October 2025 |
10.24 (-0.87%) |
10.54 |
10.20 - 10.54 |
0.8504 times |
Thu 16 October 2025 |
10.33 (0.58%) |
10.48 |
10.23 - 10.58 |
0.9536 times |
Wed 15 October 2025 |
10.27 (0.98%) |
10.57 |
10.17 - 10.70 |
0.3528 times |
Tue 14 October 2025 |
10.17 (-0.88%) |
10.26 |
9.95 - 10.76 |
1.6213 times |
Weekly price and charts MiraeamcMetal Strong weekly Stock price targets for MiraeamcMetal METAL are 10.62 and 11.12 | Weekly Target 1 | 10.21 | | Weekly Target 2 | 10.52 | | Weekly Target 3 | 10.71 | | Weekly Target 4 | 11.02 | | Weekly Target 5 | 11.21 |
Weekly price and volumes for Miraeamc Metal
| Date |
Closing |
Open |
Range |
Volume |
Wed 29 October 2025 |
10.83 (4.23%) |
10.60 |
10.40 - 10.90 |
1.2561 times |
Fri 24 October 2025 |
10.39 (1.46%) |
10.27 |
10.03 - 10.54 |
0.8286 times |
Fri 17 October 2025 |
10.24 (-0.68%) |
10.38 |
9.95 - 10.76 |
1.2104 times |
Fri 10 October 2025 |
10.31 (-0.19%) |
10.64 |
9.97 - 10.72 |
2.1344 times |
Fri 03 October 2025 |
10.33 (3.92%) |
9.94 |
9.64 - 11.50 |
1.4574 times |
Fri 26 September 2025 |
9.94 (-0.9%) |
10.28 |
9.73 - 10.38 |
0.9184 times |
Fri 19 September 2025 |
10.03 (0.91%) |
9.98 |
9.68 - 10.21 |
0.5453 times |
Fri 12 September 2025 |
9.94 (2.05%) |
9.95 |
9.58 - 10.03 |
0.7126 times |
Fri 05 September 2025 |
9.74 (5.87%) |
9.21 |
9.21 - 9.83 |
0.7977 times |
Fri 29 August 2025 |
9.20 (-2.34%) |
9.65 |
9.18 - 9.65 |
0.1391 times |
Fri 22 August 2025 |
9.42 (1.84%) |
9.20 |
9.20 - 9.79 |
1.0764 times |

Monthly price and charts MiraeamcMetal Strong monthly Stock price targets for MiraeamcMetal METAL are 10.24 and 11.5 | Monthly Target 1 | 9.2 | | Monthly Target 2 | 10.01 | | Monthly Target 3 | 10.456666666667 | | Monthly Target 4 | 11.27 | | Monthly Target 5 | 11.72 |
Monthly price and volumes Miraeamc Metal
| Date |
Closing |
Open |
Range |
Volume |
Wed 29 October 2025 |
10.83 (1.03%) |
9.64 |
9.64 - 10.90 |
2.6909 times |
Tue 30 September 2025 |
10.72 (16.52%) |
9.21 |
9.21 - 11.50 |
1.4831 times |
Fri 29 August 2025 |
9.20 (-1.08%) |
9.34 |
9.11 - 9.79 |
0.9591 times |
Thu 31 July 2025 |
9.30 (-2.82%) |
9.80 |
9.19 - 9.89 |
0.9465 times |
Mon 30 June 2025 |
9.57 (3.68%) |
9.24 |
8.96 - 9.85 |
0.5966 times |
Fri 30 May 2025 |
9.23 (7.58%) |
8.60 |
8.24 - 9.44 |
0.6189 times |
Wed 30 April 2025 |
8.58 (-5.71%) |
9.09 |
7.73 - 9.59 |
1.4981 times |
Fri 28 March 2025 |
9.10 (10.71%) |
8.29 |
8.12 - 9.51 |
0.717 times |
Fri 28 February 2025 |
8.22 (-2.26%) |
8.40 |
8.00 - 9.50 |
0.2972 times |
Fri 31 January 2025 |
8.41 (-3%) |
8.74 |
7.90 - 8.92 |
0.1926 times |
Tue 31 December 2024 |
8.67 (-3.88%) |
9.20 |
8.60 - 10.10 |
0.2693 times |

DMA SMA EMA moving averages of Miraeamc Metal METAL
DMA (daily moving average) of Miraeamc Metal METAL
| DMA period | DMA value | | 5 day DMA | 10.54 | | 12 day DMA | 10.37 | | 20 day DMA | 10.35 | | 35 day DMA | 10.19 | | 50 day DMA | 9.98 | | 100 day DMA | 9.69 | | 150 day DMA | 9.41 | | 200 day DMA | 9.18 | EMA (exponential moving average) of Miraeamc Metal METAL
| EMA period | EMA current | EMA prev | EMA prev2 | | 5 day EMA | 10.6 | 10.48 | 10.39 | | 12 day EMA | 10.44 | 10.37 | 10.32 | | 20 day EMA | 10.33 | 10.28 | 10.24 | | 35 day EMA | 10.16 | 10.12 | 10.09 | | 50 day EMA | 9.97 | 9.94 | 9.91 |
SMA (simple moving average) of Miraeamc Metal METAL
| SMA period | SMA current | SMA prev | SMA prev2 | | 5 day SMA | 10.54 | 10.43 | 10.34 | | 12 day SMA | 10.37 | 10.33 | 10.31 | | 20 day SMA | 10.35 | 10.31 | 10.27 | | 35 day SMA | 10.19 | 10.16 | 10.13 | | 50 day SMA | 9.98 | 9.95 | 9.92 | | 100 day SMA | 9.69 | 9.68 | 9.66 | | 150 day SMA | 9.41 | 9.4 | 9.39 | | 200 day SMA | 9.18 | 9.17 | 9.16 |
|
|
