MangalElectrical MEIL full analysis,charts,indicators,moving averages,SMA,DMA,EMA,ADX,MACD,RSIMangal Electrical MEIL WideScreen charts, DMA,SMA,EMA technical analysis, forecast prediction, by indicators ADX,MACD,RSI,CCI NSE stock exchange
Daily price and charts and targets MangalElectrical Strong Daily Stock price targets for MangalElectrical MEIL are 457.73 and 469.93 | Daily Target 1 | 455.35 | | Daily Target 2 | 460.1 | | Daily Target 3 | 467.55 | | Daily Target 4 | 472.3 | | Daily Target 5 | 479.75 |
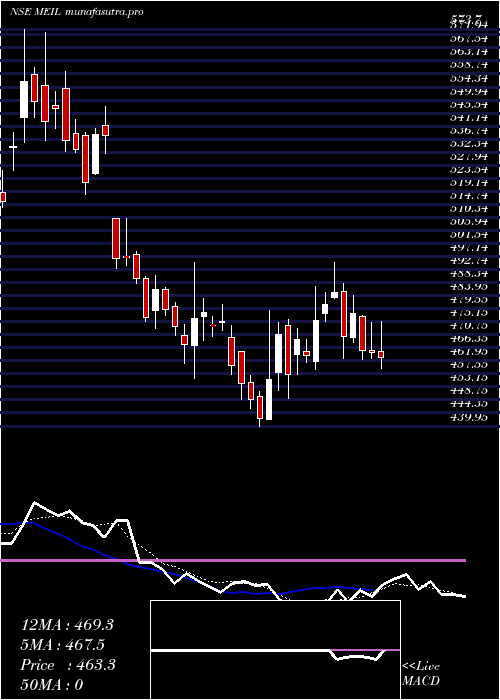
Daily price and volume Mangal Electrical
| Date |
Closing |
Open |
Range |
Volume |
Tue 28 October 2025 |
464.85 (-0.1%) |
465.30 |
462.80 - 475.00 |
0.5496 times |
Mon 27 October 2025 |
465.30 (-2.62%) |
477.00 |
462.30 - 477.30 |
1.0467 times |
Fri 24 October 2025 |
477.80 (1.62%) |
470.00 |
468.00 - 484.00 |
0.5732 times |
Thu 23 October 2025 |
470.20 (-3.06%) |
485.50 |
462.80 - 488.10 |
0.6808 times |
Tue 21 October 2025 |
485.05 (0.88%) |
483.20 |
483.00 - 495.00 |
1.378 times |
Mon 20 October 2025 |
480.80 (1.09%) |
477.95 |
475.20 - 485.00 |
0.9209 times |
Fri 17 October 2025 |
475.60 (2.58%) |
461.65 |
459.00 - 487.00 |
2.2122 times |
Thu 16 October 2025 |
463.65 (-1.19%) |
465.10 |
461.50 - 469.15 |
0.5236 times |
Wed 15 October 2025 |
469.25 (2.64%) |
464.05 |
457.20 - 473.00 |
0.8446 times |
Tue 14 October 2025 |
457.20 (-2.88%) |
473.95 |
449.10 - 475.85 |
1.2703 times |
Mon 13 October 2025 |
470.75 (3.33%) |
458.00 |
451.80 - 475.00 |
1.7914 times |
Weekly price and charts MangalElectrical Strong weekly Stock price targets for MangalElectrical MEIL are 456.08 and 471.08 | Weekly Target 1 | 453.15 | | Weekly Target 2 | 459 | | Weekly Target 3 | 468.15 | | Weekly Target 4 | 474 | | Weekly Target 5 | 483.15 |
Weekly price and volumes for Mangal Electrical
| Date |
Closing |
Open |
Range |
Volume |
Tue 28 October 2025 |
464.85 (-2.71%) |
477.00 |
462.30 - 477.30 |
0.1173 times |
Fri 24 October 2025 |
477.80 (0.46%) |
477.95 |
462.80 - 495.00 |
0.2612 times |
Fri 17 October 2025 |
475.60 (4.39%) |
458.00 |
449.10 - 487.00 |
0.4883 times |
Fri 10 October 2025 |
455.60 (-4.14%) |
470.00 |
439.95 - 479.00 |
0.5015 times |
Fri 03 October 2025 |
475.30 (1.67%) |
467.00 |
456.00 - 495.00 |
0.3804 times |
Fri 26 September 2025 |
467.50 (-4.56%) |
489.85 |
461.00 - 490.65 |
0.8363 times |
Fri 19 September 2025 |
489.85 (-6.16%) |
525.00 |
488.00 - 547.90 |
1.8223 times |
Fri 12 September 2025 |
522.00 (-5%) |
555.00 |
518.00 - 572.70 |
1.8491 times |
Fri 05 September 2025 |
549.45 (0%) |
530.00 |
513.65 - 573.70 |
2.7435 times |
Tue 28 October 2025 |
(0%) |
|
- |
0 times |

Monthly price and charts MangalElectrical Strong monthly Stock price targets for MangalElectrical MEIL are 424.88 and 479.93 | Monthly Target 1 | 411.55 | | Monthly Target 2 | 438.2 | | Monthly Target 3 | 466.6 | | Monthly Target 4 | 493.25 | | Monthly Target 5 | 521.65 |
Monthly price and volumes Mangal Electrical
| Date |
Closing |
Open |
Range |
Volume |
Tue 28 October 2025 |
464.85 (-2.81%) |
474.00 |
439.95 - 495.00 |
0.2873 times |
Tue 30 September 2025 |
478.30 (-9.31%) |
530.00 |
456.00 - 573.70 |
1.4413 times |
Fri 29 August 2025 |
527.40 (0%) |
556.00 |
525.20 - 566.00 |
1.2714 times |
Tue 28 October 2025 |
(0%) |
|
- |
0 times |

DMA SMA EMA moving averages of Mangal Electrical MEIL
DMA (daily moving average) of Mangal Electrical MEIL
| DMA period | DMA value | | 5 day DMA | 472.64 | | 12 day DMA | 469.67 | | 20 day DMA | 467.27 | | 35 day DMA | 484.83 | | 50 day DMA | | | 100 day DMA | | | 150 day DMA | | | 200 day DMA | | EMA (exponential moving average) of Mangal Electrical MEIL
| EMA period | EMA current | EMA prev | EMA prev2 | | 5 day EMA | 469.62 | 472.01 | 475.37 | | 12 day EMA | 470.36 | 471.36 | 472.46 | | 20 day EMA | 474.47 | 475.48 | 476.55 | | 35 day EMA | 489.1 | 490.53 | 492.02 | | 50 day EMA | 0 | 0 | 0 |
SMA (simple moving average) of Mangal Electrical MEIL
| SMA period | SMA current | SMA prev | SMA prev2 | | 5 day SMA | 472.64 | 475.83 | 477.89 | | 12 day SMA | 469.67 | 467.81 | 466.45 | | 20 day SMA | 467.27 | 467.4 | 467.81 | | 35 day SMA | 484.83 | 487.25 | 489.85 | | 50 day SMA | | 100 day SMA | | 150 day SMA | | 200 day SMA |
|
|
