MedplusHealth MEDPLUS full analysis,charts,indicators,moving averages,SMA,DMA,EMA,ADX,MACD,RSIMedplus Health MEDPLUS WideScreen charts, DMA,SMA,EMA technical analysis, forecast prediction, by indicators ADX,MACD,RSI,CCI NSE stock exchange
Daily price and charts and targets MedplusHealth Strong Daily Stock price targets for MedplusHealth MEDPLUS are 740.93 and 756.68 | Daily Target 1 | 737.95 | | Daily Target 2 | 743.9 | | Daily Target 3 | 753.7 | | Daily Target 4 | 759.65 | | Daily Target 5 | 769.45 |
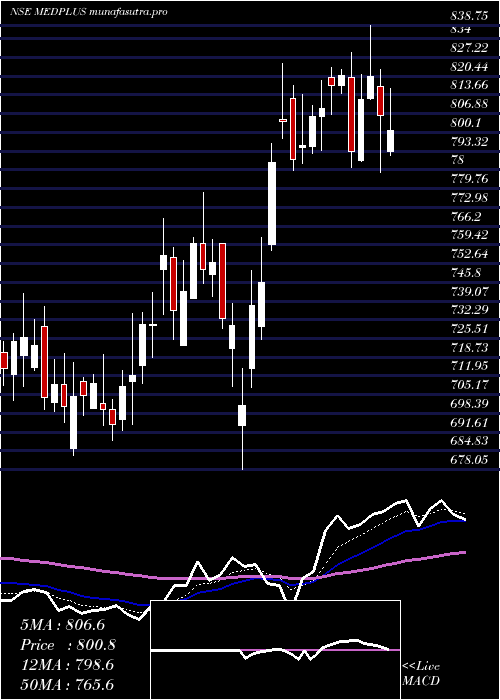
Daily price and volume Medplus Health
| Date |
Closing |
Open |
Range |
Volume |
Tue 28 October 2025 |
749.85 (-1.1%) |
753.05 |
747.75 - 763.50 |
2.1262 times |
Mon 27 October 2025 |
758.20 (-0.11%) |
752.60 |
752.00 - 761.75 |
0.8689 times |
Fri 24 October 2025 |
759.00 (0.58%) |
758.60 |
750.00 - 762.00 |
0.6122 times |
Thu 23 October 2025 |
754.65 (-0.94%) |
765.80 |
750.35 - 767.35 |
0.7465 times |
Tue 21 October 2025 |
761.80 (-0.69%) |
765.00 |
759.95 - 772.25 |
0.2027 times |
Mon 20 October 2025 |
767.10 (0.47%) |
763.50 |
757.00 - 777.00 |
0.4922 times |
Fri 17 October 2025 |
763.50 (0.47%) |
759.00 |
751.50 - 777.00 |
1.5028 times |
Thu 16 October 2025 |
759.95 (0.42%) |
756.75 |
753.90 - 769.85 |
0.6321 times |
Wed 15 October 2025 |
756.75 (-1.73%) |
768.10 |
750.50 - 771.60 |
1.7004 times |
Tue 14 October 2025 |
770.05 (-1.03%) |
774.95 |
750.00 - 777.95 |
1.116 times |
Mon 13 October 2025 |
778.05 (-0.78%) |
770.10 |
763.35 - 792.25 |
0.82 times |
Weekly price and charts MedplusHealth Strong weekly Stock price targets for MedplusHealth MEDPLUS are 740.93 and 756.68 | Weekly Target 1 | 737.95 | | Weekly Target 2 | 743.9 | | Weekly Target 3 | 753.7 | | Weekly Target 4 | 759.65 | | Weekly Target 5 | 769.45 |
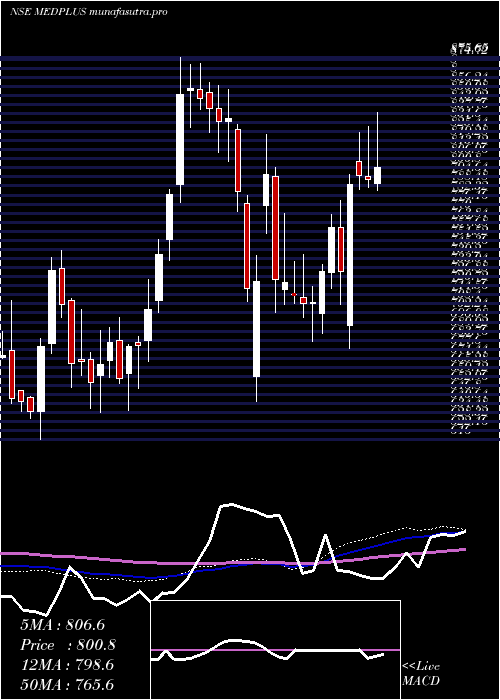
Weekly price and volumes for Medplus Health
| Date |
Closing |
Open |
Range |
Volume |
Tue 28 October 2025 |
749.85 (-1.21%) |
752.60 |
747.75 - 763.50 |
0.5642 times |
Fri 24 October 2025 |
759.00 (-0.59%) |
763.50 |
750.00 - 777.00 |
0.3869 times |
Fri 17 October 2025 |
763.50 (-2.64%) |
770.10 |
750.00 - 792.25 |
1.0872 times |
Fri 10 October 2025 |
784.20 (5.03%) |
746.65 |
734.00 - 797.45 |
1.2548 times |
Fri 03 October 2025 |
746.65 (-5.12%) |
780.30 |
732.00 - 798.20 |
0.8497 times |
Fri 26 September 2025 |
786.90 (-6.38%) |
840.55 |
778.05 - 843.35 |
1.383 times |
Fri 19 September 2025 |
840.55 (0.21%) |
838.00 |
824.80 - 853.60 |
1.4383 times |
Fri 12 September 2025 |
838.75 (0.75%) |
832.50 |
823.05 - 843.65 |
0.7673 times |
Fri 05 September 2025 |
832.50 (-1.12%) |
841.95 |
827.45 - 858.60 |
1.501 times |
Fri 29 August 2025 |
841.95 (2.52%) |
825.60 |
822.65 - 849.95 |
0.7676 times |
Fri 22 August 2025 |
821.25 (0.92%) |
815.10 |
803.50 - 847.10 |
1.7575 times |
Monthly price and charts MedplusHealth Strong monthly Stock price targets for MedplusHealth MEDPLUS are 708.2 and 773.65 | Monthly Target 1 | 694.32 | | Monthly Target 2 | 722.08 | | Monthly Target 3 | 759.76666666667 | | Monthly Target 4 | 787.53 | | Monthly Target 5 | 825.22 |
Monthly price and volumes Medplus Health
| Date |
Closing |
Open |
Range |
Volume |
Tue 28 October 2025 |
749.85 (-1%) |
752.95 |
732.00 - 797.45 |
0.4699 times |
Tue 30 September 2025 |
757.45 (-10.04%) |
841.95 |
746.60 - 858.60 |
0.7028 times |
Fri 29 August 2025 |
841.95 (-9.52%) |
931.00 |
800.55 - 940.00 |
1.3883 times |
Thu 31 July 2025 |
930.55 (2.88%) |
900.05 |
843.80 - 945.00 |
0.8084 times |
Mon 30 June 2025 |
904.50 (-6.41%) |
966.40 |
849.80 - 968.35 |
1.0436 times |
Fri 30 May 2025 |
966.40 (19.88%) |
793.05 |
788.30 - 1045.30 |
1.5528 times |
Wed 30 April 2025 |
806.15 (6.07%) |
760.00 |
678.05 - 838.75 |
0.7399 times |
Fri 28 March 2025 |
760.00 (6.35%) |
712.60 |
683.05 - 769.00 |
0.7951 times |
Fri 28 February 2025 |
714.60 (-1.21%) |
775.30 |
702.65 - 823.50 |
1.2064 times |
Fri 31 January 2025 |
723.35 (-12.94%) |
825.40 |
642.00 - 856.95 |
1.2926 times |
Tue 31 December 2024 |
830.85 (6.15%) |
789.80 |
777.25 - 875.65 |
2.6 times |
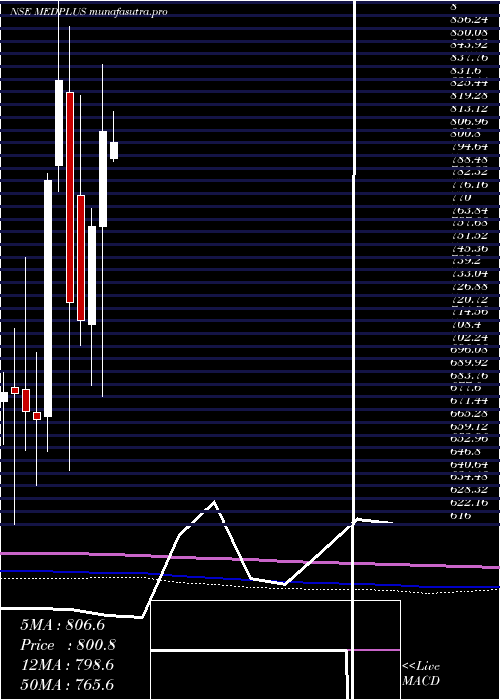
DMA SMA EMA moving averages of Medplus Health MEDPLUS
DMA (daily moving average) of Medplus Health MEDPLUS
| DMA period | DMA value | | 5 day DMA | 756.7 | | 12 day DMA | 763.59 | | 20 day DMA | 761.05 | | 35 day DMA | 788.58 | | 50 day DMA | 802.21 | | 100 day DMA | 842.95 | | 150 day DMA | 836.52 | | 200 day DMA | 814.53 | EMA (exponential moving average) of Medplus Health MEDPLUS
| EMA period | EMA current | EMA prev | EMA prev2 | | 5 day EMA | 756.36 | 759.61 | 760.31 | | 12 day EMA | 761.65 | 763.8 | 764.82 | | 20 day EMA | 768.83 | 770.83 | 772.16 | | 35 day EMA | 782.56 | 784.49 | 786.04 | | 50 day EMA | 799.42 | 801.44 | 803.2 |
SMA (simple moving average) of Medplus Health MEDPLUS
| SMA period | SMA current | SMA prev | SMA prev2 | | 5 day SMA | 756.7 | 760.15 | 761.21 | | 12 day SMA | 763.59 | 766.07 | 766.48 | | 20 day SMA | 761.05 | 762.9 | 764.95 | | 35 day SMA | 788.58 | 790.94 | 793.33 | | 50 day SMA | 802.21 | 803.3 | 804.43 | | 100 day SMA | 842.95 | 844.55 | 846.14 | | 150 day SMA | 836.52 | 836.25 | 835.82 | | 200 day SMA | 814.53 | 814.84 | 815.21 |
|
|
