GlobalHealth MEDANTA full analysis,charts,indicators,moving averages,SMA,DMA,EMA,ADX,MACD,RSIGlobal Health MEDANTA WideScreen charts, DMA,SMA,EMA technical analysis, forecast prediction, by indicators ADX,MACD,RSI,CCI NSE stock exchange
Daily price and charts and targets GlobalHealth Strong Daily Stock price targets for GlobalHealth MEDANTA are 1338.4 and 1363 | Daily Target 1 | 1332.73 | | Daily Target 2 | 1344.07 | | Daily Target 3 | 1357.3333333333 | | Daily Target 4 | 1368.67 | | Daily Target 5 | 1381.93 |
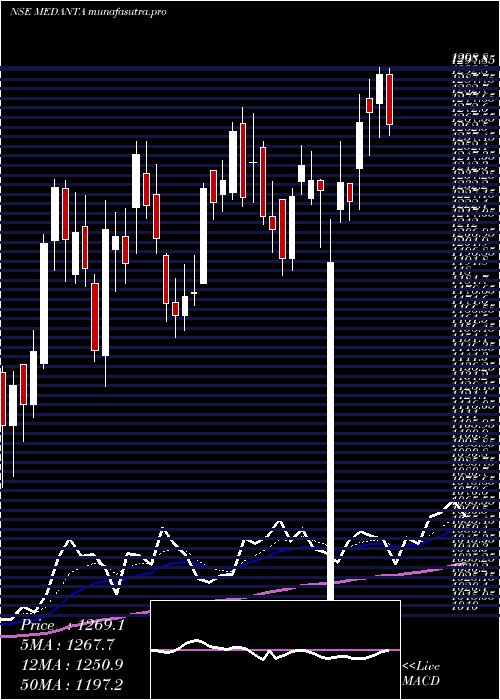
Daily price and volume Global Health
| Date |
Closing |
Open |
Range |
Volume |
Tue 28 October 2025 |
1355.40 (0.53%) |
1359.20 |
1346.00 - 1370.60 |
0.4723 times |
Mon 27 October 2025 |
1348.30 (0.12%) |
1346.70 |
1335.80 - 1355.00 |
0.4284 times |
Fri 24 October 2025 |
1346.70 (-0.5%) |
1355.00 |
1336.00 - 1358.80 |
0.9035 times |
Thu 23 October 2025 |
1353.50 (-2.8%) |
1387.40 |
1350.00 - 1389.90 |
0.5977 times |
Tue 21 October 2025 |
1392.50 (0.59%) |
1395.00 |
1388.00 - 1404.00 |
0.1149 times |
Mon 20 October 2025 |
1384.40 (0.93%) |
1384.00 |
1367.20 - 1395.10 |
0.4435 times |
Fri 17 October 2025 |
1371.70 (-1.74%) |
1405.00 |
1368.50 - 1407.20 |
0.4992 times |
Thu 16 October 2025 |
1396.00 (3.27%) |
1354.90 |
1354.90 - 1414.70 |
2.496 times |
Wed 15 October 2025 |
1351.80 (0.01%) |
1351.60 |
1348.80 - 1364.00 |
0.3718 times |
Tue 14 October 2025 |
1351.60 (-0.83%) |
1359.90 |
1346.90 - 1360.00 |
3.6727 times |
Mon 13 October 2025 |
1362.90 (1%) |
1336.50 |
1335.10 - 1369.90 |
0.7844 times |
Weekly price and charts GlobalHealth Strong weekly Stock price targets for GlobalHealth MEDANTA are 1345.6 and 1380.4 | Weekly Target 1 | 1319.13 | | Weekly Target 2 | 1337.27 | | Weekly Target 3 | 1353.9333333333 | | Weekly Target 4 | 1372.07 | | Weekly Target 5 | 1388.73 |
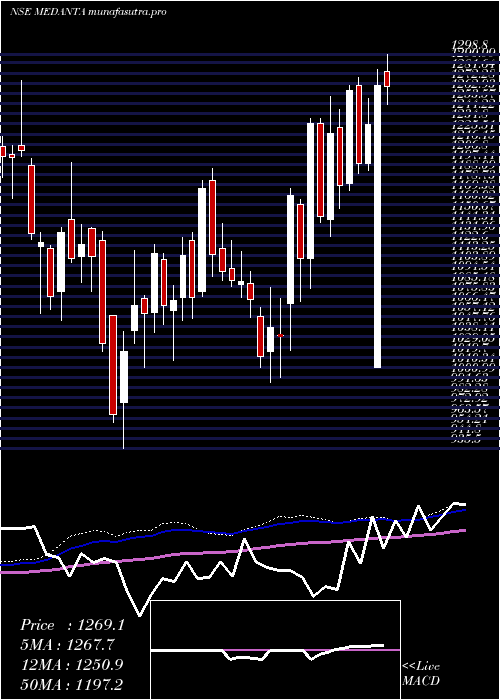
Weekly price and volumes for Global Health
| Date |
Closing |
Open |
Range |
Volume |
Tue 28 October 2025 |
1355.40 (0.65%) |
1346.70 |
1335.80 - 1370.60 |
0.1595 times |
Fri 24 October 2025 |
1346.70 (-1.82%) |
1384.00 |
1336.00 - 1404.00 |
0.3647 times |
Fri 17 October 2025 |
1371.70 (1.65%) |
1336.50 |
1335.10 - 1414.70 |
1.3853 times |
Fri 10 October 2025 |
1349.40 (1.55%) |
1329.50 |
1324.60 - 1392.60 |
1.281 times |
Fri 03 October 2025 |
1328.80 (2.24%) |
1295.00 |
1286.30 - 1340.00 |
0.6832 times |
Fri 26 September 2025 |
1299.70 (-4.02%) |
1354.20 |
1284.30 - 1358.80 |
0.6687 times |
Fri 19 September 2025 |
1354.20 (2.41%) |
1322.30 |
1316.00 - 1394.00 |
1.9605 times |
Fri 12 September 2025 |
1322.30 (-6.11%) |
1410.00 |
1316.00 - 1417.40 |
1.1192 times |
Fri 05 September 2025 |
1408.40 (2.5%) |
1374.00 |
1368.10 - 1454.00 |
1.3533 times |
Fri 29 August 2025 |
1374.00 (-0.77%) |
1399.00 |
1365.30 - 1426.00 |
1.0248 times |
Fri 22 August 2025 |
1384.70 (0.77%) |
1385.00 |
1332.50 - 1428.90 |
1.7462 times |
Monthly price and charts GlobalHealth Strong monthly Stock price targets for GlobalHealth MEDANTA are 1324.3 and 1445.8 | Monthly Target 1 | 1232.93 | | Monthly Target 2 | 1294.17 | | Monthly Target 3 | 1354.4333333333 | | Monthly Target 4 | 1415.67 | | Monthly Target 5 | 1475.93 |
Monthly price and volumes Global Health
| Date |
Closing |
Open |
Range |
Volume |
Tue 28 October 2025 |
1355.40 (3.15%) |
1310.40 |
1293.20 - 1414.70 |
0.5956 times |
Tue 30 September 2025 |
1314.00 (-4.37%) |
1374.00 |
1284.30 - 1454.00 |
0.9455 times |
Fri 29 August 2025 |
1374.00 (4.79%) |
1304.00 |
1303.00 - 1456.50 |
1.5801 times |
Thu 31 July 2025 |
1311.20 (15.34%) |
1139.30 |
1137.00 - 1393.20 |
1.7498 times |
Mon 30 June 2025 |
1136.80 (-4.33%) |
1188.20 |
1094.20 - 1226.90 |
0.6488 times |
Fri 30 May 2025 |
1188.20 (-0.75%) |
1208.70 |
1151.00 - 1252.90 |
0.5529 times |
Wed 30 April 2025 |
1197.20 (-0.09%) |
1198.30 |
1010.00 - 1298.80 |
0.5911 times |
Fri 28 March 2025 |
1198.30 (4.23%) |
1147.00 |
1130.60 - 1277.90 |
0.7817 times |
Fri 28 February 2025 |
1149.65 (10.59%) |
1069.70 |
1026.30 - 1239.90 |
1.3471 times |
Fri 31 January 2025 |
1039.60 (-3.61%) |
1081.60 |
996.45 - 1117.20 |
1.2073 times |
Tue 31 December 2024 |
1078.50 (0.31%) |
1079.90 |
1074.55 - 1193.20 |
1.2898 times |

DMA SMA EMA moving averages of Global Health MEDANTA
DMA (daily moving average) of Global Health MEDANTA
| DMA period | DMA value | | 5 day DMA | 1359.28 | | 12 day DMA | 1363.68 | | 20 day DMA | 1355.26 | | 35 day DMA | 1351.65 | | 50 day DMA | 1363.27 | | 100 day DMA | 1309.46 | | 150 day DMA | 1280.1 | | 200 day DMA | 1240.22 | EMA (exponential moving average) of Global Health MEDANTA
| EMA period | EMA current | EMA prev | EMA prev2 | | 5 day EMA | 1357.32 | 1358.28 | 1363.27 | | 12 day EMA | 1359.99 | 1360.82 | 1363.09 | | 20 day EMA | 1358.61 | 1358.95 | 1360.07 | | 35 day EMA | 1362.07 | 1362.46 | 1363.29 | | 50 day EMA | 1363.71 | 1364.05 | 1364.69 |
SMA (simple moving average) of Global Health MEDANTA
| SMA period | SMA current | SMA prev | SMA prev2 | | 5 day SMA | 1359.28 | 1365.08 | 1369.76 | | 12 day SMA | 1363.68 | 1365.28 | 1368.45 | | 20 day SMA | 1355.26 | 1352.48 | 1351.5 | | 35 day SMA | 1351.65 | 1353.16 | 1355.23 | | 50 day SMA | 1363.27 | 1363.28 | 1363.92 | | 100 day SMA | 1309.46 | 1307.87 | 1306.56 | | 150 day SMA | 1280.1 | 1279.25 | 1278.5 | | 200 day SMA | 1240.22 | 1238.79 | 1237.49 |
|
|
