MB MBAPL full analysis,charts,indicators,moving averages,SMA,DMA,EMA,ADX,MACD,RSIM B MBAPL WideScreen charts, DMA,SMA,EMA technical analysis, forecast prediction, by indicators ADX,MACD,RSI,CCI NSE stock exchange
Daily price and charts and targets MB Strong Daily Stock price targets for MB MBAPL are 403.55 and 411.35 | Daily Target 1 | 401.8 | | Daily Target 2 | 405.3 | | Daily Target 3 | 409.6 | | Daily Target 4 | 413.1 | | Daily Target 5 | 417.4 |
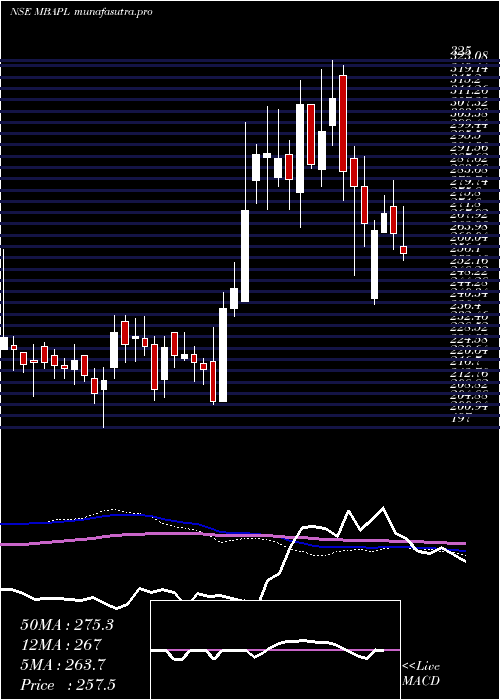
Daily price and volume M B
| Date |
Closing |
Open |
Range |
Volume |
Tue 28 October 2025 |
408.80 (-0.45%) |
412.00 |
406.10 - 413.90 |
0.5992 times |
Mon 27 October 2025 |
410.65 (0.54%) |
408.00 |
402.30 - 414.20 |
0.6723 times |
Fri 24 October 2025 |
408.45 (-3.57%) |
422.00 |
403.00 - 422.25 |
1.2613 times |
Thu 23 October 2025 |
423.55 (-6.42%) |
464.00 |
420.05 - 464.70 |
1.6134 times |
Tue 21 October 2025 |
452.60 (-1.56%) |
465.00 |
433.85 - 469.70 |
0.8029 times |
Mon 20 October 2025 |
459.75 (2.68%) |
450.00 |
445.00 - 463.70 |
1.9961 times |
Fri 17 October 2025 |
447.75 (2.18%) |
441.90 |
435.00 - 450.95 |
1.147 times |
Thu 16 October 2025 |
438.20 (1.74%) |
432.85 |
432.80 - 445.00 |
0.7778 times |
Wed 15 October 2025 |
430.70 (0.78%) |
430.00 |
423.05 - 434.70 |
0.561 times |
Tue 14 October 2025 |
427.35 (-0.9%) |
434.80 |
425.10 - 441.65 |
0.569 times |
Mon 13 October 2025 |
431.25 (-1.91%) |
446.00 |
425.80 - 454.70 |
1.1454 times |

Weekly price and charts MB Strong weekly Stock price targets for MB MBAPL are 405.55 and 417.45 | Weekly Target 1 | 396.53 | | Weekly Target 2 | 402.67 | | Weekly Target 3 | 408.43333333333 | | Weekly Target 4 | 414.57 | | Weekly Target 5 | 420.33 |
Weekly price and volumes for M B
| Date |
Closing |
Open |
Range |
Volume |
Tue 28 October 2025 |
408.80 (0.09%) |
408.00 |
402.30 - 414.20 |
0.3093 times |
Fri 24 October 2025 |
408.45 (-8.78%) |
450.00 |
403.00 - 469.70 |
1.38 times |
Fri 17 October 2025 |
447.75 (1.84%) |
446.00 |
423.05 - 454.70 |
1.0216 times |
Fri 10 October 2025 |
439.65 (11.35%) |
397.80 |
397.75 - 453.80 |
1.9313 times |
Fri 03 October 2025 |
394.85 (-3.39%) |
408.70 |
373.15 - 410.35 |
0.8918 times |
Fri 26 September 2025 |
408.70 (-5%) |
430.20 |
403.75 - 433.20 |
0.6008 times |
Fri 19 September 2025 |
430.20 (2.67%) |
423.00 |
420.25 - 436.95 |
0.9871 times |
Fri 12 September 2025 |
419.00 (0.67%) |
420.10 |
395.50 - 426.75 |
1.1872 times |
Fri 05 September 2025 |
416.20 (-0.99%) |
420.45 |
412.80 - 429.85 |
0.6114 times |
Fri 29 August 2025 |
420.35 (-5.43%) |
445.95 |
410.75 - 458.00 |
1.0794 times |
Fri 22 August 2025 |
444.50 (5.32%) |
429.95 |
419.60 - 454.90 |
1.3654 times |
Monthly price and charts MB Strong monthly Stock price targets for MB MBAPL are 392.03 and 486.48 | Monthly Target 1 | 323.47 | | Monthly Target 2 | 366.13 | | Monthly Target 3 | 417.91666666667 | | Monthly Target 4 | 460.58 | | Monthly Target 5 | 512.37 |
Monthly price and volumes M B
| Date |
Closing |
Open |
Range |
Volume |
Tue 28 October 2025 |
408.80 (7.95%) |
376.65 |
375.25 - 469.70 |
1.4128 times |
Tue 30 September 2025 |
378.70 (-9.91%) |
420.45 |
373.15 - 436.95 |
1.0806 times |
Fri 29 August 2025 |
420.35 (-5.75%) |
445.00 |
410.00 - 458.00 |
1.1571 times |
Thu 31 July 2025 |
446.00 (7.07%) |
418.00 |
393.55 - 465.00 |
2.2842 times |
Mon 30 June 2025 |
416.55 (22.71%) |
350.00 |
340.00 - 442.00 |
2.2791 times |
Fri 30 May 2025 |
339.45 (27.95%) |
265.30 |
252.00 - 344.40 |
0.4495 times |
Wed 30 April 2025 |
265.30 (-5.55%) |
280.90 |
240.00 - 291.45 |
0.0864 times |
Fri 28 March 2025 |
280.90 (-2.67%) |
287.00 |
250.00 - 325.00 |
0.3183 times |
Fri 28 February 2025 |
288.60 (-1.37%) |
284.00 |
266.70 - 318.00 |
0.2442 times |
Fri 31 January 2025 |
292.62 (27.54%) |
229.80 |
225.30 - 308.98 |
0.6878 times |
Tue 31 December 2024 |
229.44 (3.33%) |
221.00 |
205.01 - 235.00 |
0.0951 times |
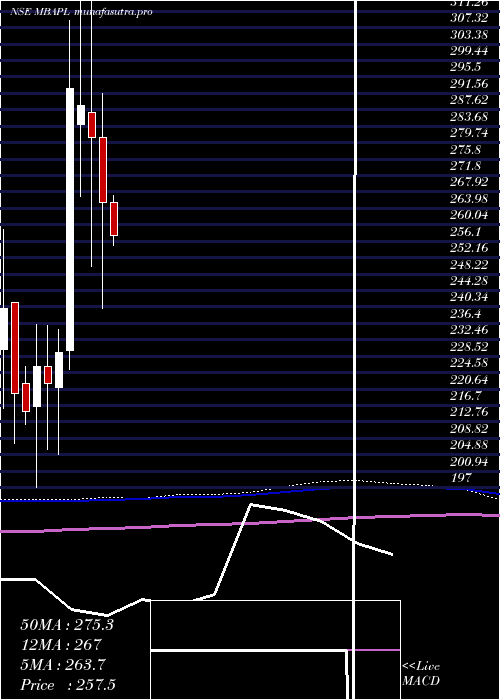
DMA SMA EMA moving averages of M B MBAPL
DMA (daily moving average) of M B MBAPL
| DMA period | DMA value | | 5 day DMA | 420.81 | | 12 day DMA | 431.56 | | 20 day DMA | 422.55 | | 35 day DMA | 421.5 | | 50 day DMA | 423.28 | | 100 day DMA | 416.16 | | 150 day DMA | 372.95 | | 200 day DMA | 351.83 | EMA (exponential moving average) of M B MBAPL
| EMA period | EMA current | EMA prev | EMA prev2 | | 5 day EMA | 418.28 | 423.02 | 429.21 | | 12 day EMA | 425.03 | 427.98 | 431.13 | | 20 day EMA | 425.19 | 426.92 | 428.63 | | 35 day EMA | 424.57 | 425.5 | 426.37 | | 50 day EMA | 422.8 | 423.37 | 423.89 |
SMA (simple moving average) of M B MBAPL
| SMA period | SMA current | SMA prev | SMA prev2 | | 5 day SMA | 420.81 | 431 | 438.42 | | 12 day SMA | 431.56 | 434.1 | 436.6 | | 20 day SMA | 422.55 | 422.55 | 422.83 | | 35 day SMA | 421.5 | 421.71 | 422.01 | | 50 day SMA | 423.28 | 423.51 | 423.74 | | 100 day SMA | 416.16 | 415.64 | 415.02 | | 150 day SMA | 372.95 | 372.21 | 371.5 | | 200 day SMA | 351.83 | 351.01 | 350.15 |
|
|
