Maxposure MAXPOSURE_SM full analysis,charts,indicators,moving averages,SMA,DMA,EMA,ADX,MACD,RSIMaxposure MAXPOSURE_SM WideScreen charts, DMA,SMA,EMA technical analysis, forecast prediction, by indicators ADX,MACD,RSI,CCI NSE stock exchange
Daily price and charts and targets Maxposure Strong Daily Stock price targets for Maxposure MAXPOSURE_SM are 51.48 and 52.43 | Daily Target 1 | 51.32 | | Daily Target 2 | 51.63 | | Daily Target 3 | 52.266666666667 | | Daily Target 4 | 52.58 | | Daily Target 5 | 53.22 |
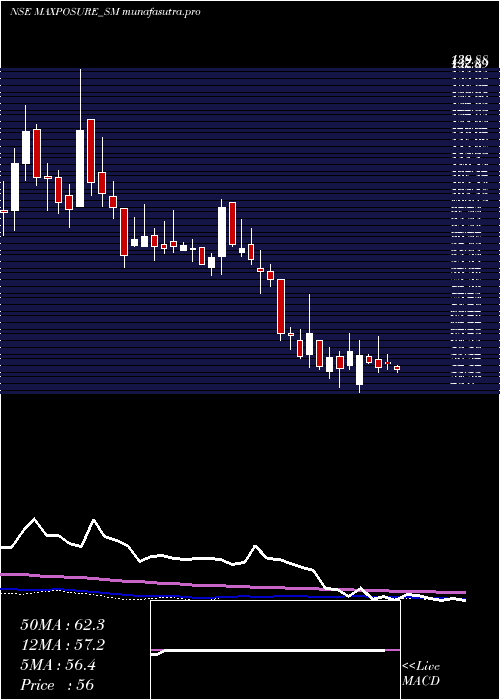
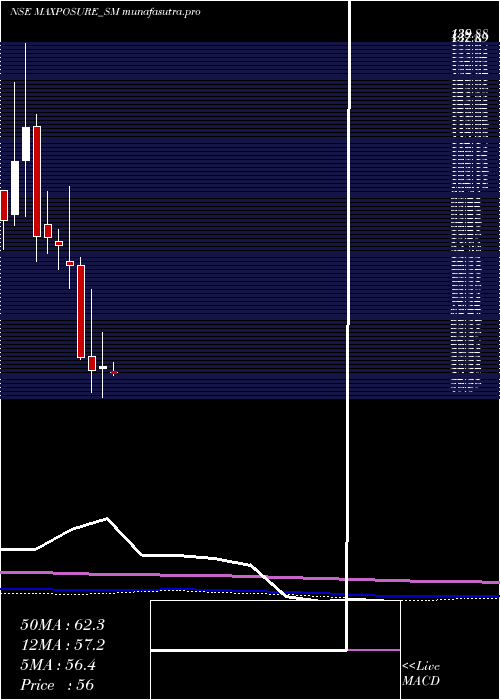
Daily price and volume Maxposure
| Date |
Closing |
Open |
Range |
Volume |
Tue 28 October 2025 |
51.95 (-1.8%) |
52.90 |
51.95 - 52.90 |
0.1508 times |
Mon 27 October 2025 |
52.90 (2.42%) |
50.70 |
48.30 - 53.20 |
1.1558 times |
Fri 24 October 2025 |
51.65 (-1.62%) |
53.00 |
50.00 - 53.00 |
2.4623 times |
Thu 23 October 2025 |
52.50 (-1.22%) |
53.00 |
51.00 - 53.00 |
1.608 times |
Tue 21 October 2025 |
53.15 (-0.37%) |
53.00 |
53.00 - 53.35 |
0.1005 times |
Mon 20 October 2025 |
53.35 (1.43%) |
52.60 |
52.50 - 53.35 |
0.3518 times |
Fri 17 October 2025 |
52.60 (0.19%) |
52.50 |
52.20 - 52.60 |
0.3518 times |
Thu 16 October 2025 |
52.50 (-2.23%) |
55.15 |
51.20 - 55.15 |
1.6583 times |
Wed 15 October 2025 |
53.70 (-0.46%) |
52.05 |
52.05 - 54.00 |
0.2513 times |
Tue 14 October 2025 |
53.95 (-0.92%) |
53.20 |
50.60 - 54.00 |
1.9095 times |
Mon 13 October 2025 |
54.45 (-2.68%) |
54.55 |
53.85 - 54.90 |
1.0553 times |

Weekly price and charts Maxposure Strong weekly Stock price targets for Maxposure MAXPOSURE_SM are 50.13 and 55.03 | Weekly Target 1 | 46.25 | | Weekly Target 2 | 49.1 | | Weekly Target 3 | 51.15 | | Weekly Target 4 | 54 | | Weekly Target 5 | 56.05 |
Weekly price and volumes for Maxposure
| Date |
Closing |
Open |
Range |
Volume |
Tue 28 October 2025 |
51.95 (0.58%) |
50.70 |
48.30 - 53.20 |
0.3214 times |
Fri 24 October 2025 |
51.65 (-1.81%) |
52.60 |
50.00 - 53.35 |
1.1125 times |
Fri 17 October 2025 |
52.60 (-5.99%) |
54.55 |
50.60 - 55.15 |
1.2855 times |
Fri 10 October 2025 |
55.95 (-0.09%) |
55.10 |
53.50 - 56.15 |
0.6675 times |
Fri 03 October 2025 |
56.00 (0.81%) |
55.10 |
52.00 - 58.00 |
0.6799 times |
Fri 26 September 2025 |
55.55 (-5.45%) |
58.75 |
55.00 - 58.80 |
0.3214 times |
Fri 19 September 2025 |
58.75 (2.35%) |
57.65 |
56.50 - 61.20 |
0.4944 times |
Fri 12 September 2025 |
57.40 (-3.2%) |
60.00 |
56.00 - 62.50 |
2.6205 times |
Fri 05 September 2025 |
59.30 (3.58%) |
57.25 |
57.00 - 61.30 |
2.1755 times |
Fri 29 August 2025 |
57.25 (-3.7%) |
60.00 |
57.25 - 60.00 |
0.3214 times |
Fri 22 August 2025 |
59.45 (3.39%) |
63.95 |
58.40 - 64.00 |
0.5315 times |
Monthly price and charts Maxposure Strong monthly Stock price targets for Maxposure MAXPOSURE_SM are 45.28 and 54.98 | Monthly Target 1 | 43.05 | | Monthly Target 2 | 47.5 | | Monthly Target 3 | 52.75 | | Monthly Target 4 | 57.2 | | Monthly Target 5 | 62.45 |
Monthly price and volumes Maxposure
| Date |
Closing |
Open |
Range |
Volume |
Tue 28 October 2025 |
51.95 (-1.52%) |
55.70 |
48.30 - 58.00 |
0.558 times |
Tue 30 September 2025 |
52.75 (-7.86%) |
57.25 |
52.00 - 62.50 |
0.884 times |
Fri 29 August 2025 |
57.25 (-3.7%) |
61.30 |
55.10 - 64.00 |
0.3996 times |
Thu 31 July 2025 |
59.45 (13.45%) |
52.50 |
50.90 - 74.00 |
1.7901 times |
Mon 30 June 2025 |
52.40 (-11.64%) |
61.40 |
52.20 - 63.30 |
0.477 times |
Fri 30 May 2025 |
59.30 (3.22%) |
56.00 |
51.30 - 68.00 |
0.7937 times |
Wed 30 April 2025 |
57.45 (1.95%) |
57.00 |
49.60 - 66.00 |
0.7808 times |
Fri 28 March 2025 |
56.35 (-5.53%) |
60.05 |
51.00 - 76.75 |
1.5543 times |
Fri 28 February 2025 |
59.65 (-28.13%) |
83.00 |
59.10 - 85.00 |
1.186 times |
Fri 31 January 2025 |
83.00 (-5.63%) |
84.00 |
77.00 - 102.95 |
1.5764 times |
Mon 30 December 2024 |
87.95 (-2.28%) |
88.90 |
81.90 - 92.00 |
0.5378 times |
DMA SMA EMA moving averages of Maxposure MAXPOSURE_SM
DMA (daily moving average) of Maxposure MAXPOSURE_SM
| DMA period | DMA value | | 5 day DMA | 52.43 | | 12 day DMA | 53.22 | | 20 day DMA | 54.05 | | 35 day DMA | 55.73 | | 50 day DMA | 56.59 | | 100 day DMA | 57.34 | | 150 day DMA | 57.73 | | 200 day DMA | 63.18 | EMA (exponential moving average) of Maxposure MAXPOSURE_SM
| EMA period | EMA current | EMA prev | EMA prev2 | | 5 day EMA | 52.44 | 52.68 | 52.57 | | 12 day EMA | 53.18 | 53.4 | 53.49 | | 20 day EMA | 53.99 | 54.21 | 54.35 | | 35 day EMA | 55.19 | 55.38 | 55.53 | | 50 day EMA | 56.43 | 56.61 | 56.76 |
SMA (simple moving average) of Maxposure MAXPOSURE_SM
| SMA period | SMA current | SMA prev | SMA prev2 | | 5 day SMA | 52.43 | 52.71 | 52.65 | | 12 day SMA | 53.22 | 53.48 | 53.58 | | 20 day SMA | 54.05 | 54.23 | 54.42 | | 35 day SMA | 55.73 | 55.89 | 56.02 | | 50 day SMA | 56.59 | 56.71 | 56.84 | | 100 day SMA | 57.34 | 57.43 | 57.57 | | 150 day SMA | 57.73 | 57.82 | 57.9 | | 200 day SMA | 63.18 | 63.34 | 63.5 |
|
|
