MaxIndia MAXIND full analysis,charts,indicators,moving averages,SMA,DMA,EMA,ADX,MACD,RSIMax India MAXIND WideScreen charts, DMA,SMA,EMA technical analysis, forecast prediction, by indicators ADX,MACD,RSI,CCI NSE stock exchange
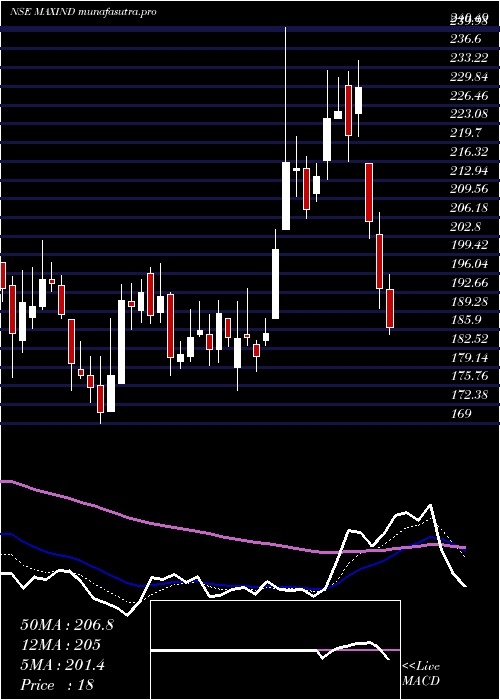
Daily price and charts and targets MaxIndia Strong Daily Stock price targets for MaxIndia MAXIND are 208.09 and 214.58 | Daily Target 1 | 206.73 | | Daily Target 2 | 209.44 | | Daily Target 3 | 213.22 | | Daily Target 4 | 215.93 | | Daily Target 5 | 219.71 |
Daily price and volume Max India
| Date |
Closing |
Open |
Range |
Volume |
Wed 29 October 2025 |
212.15 (0.15%) |
215.00 |
210.51 - 217.00 |
0.4473 times |
Tue 28 October 2025 |
211.84 (-2.33%) |
216.00 |
207.45 - 219.10 |
1.0234 times |
Mon 27 October 2025 |
216.89 (1.74%) |
216.40 |
214.00 - 218.55 |
0.7381 times |
Fri 24 October 2025 |
213.19 (-1.5%) |
218.60 |
212.00 - 219.98 |
0.7677 times |
Thu 23 October 2025 |
216.43 (-1.09%) |
218.82 |
214.11 - 220.00 |
0.792 times |
Tue 21 October 2025 |
218.82 (1.51%) |
216.50 |
212.01 - 220.99 |
0.8341 times |
Mon 20 October 2025 |
215.56 (2.86%) |
208.20 |
208.20 - 225.01 |
3.0965 times |
Fri 17 October 2025 |
209.56 (-1.99%) |
215.95 |
208.60 - 215.95 |
0.7761 times |
Thu 16 October 2025 |
213.82 (1.94%) |
209.75 |
209.75 - 216.00 |
1.1113 times |
Wed 15 October 2025 |
209.75 (0.09%) |
211.70 |
208.65 - 211.70 |
0.4133 times |
Tue 14 October 2025 |
209.57 (-0.49%) |
214.50 |
207.96 - 214.50 |
0.6124 times |
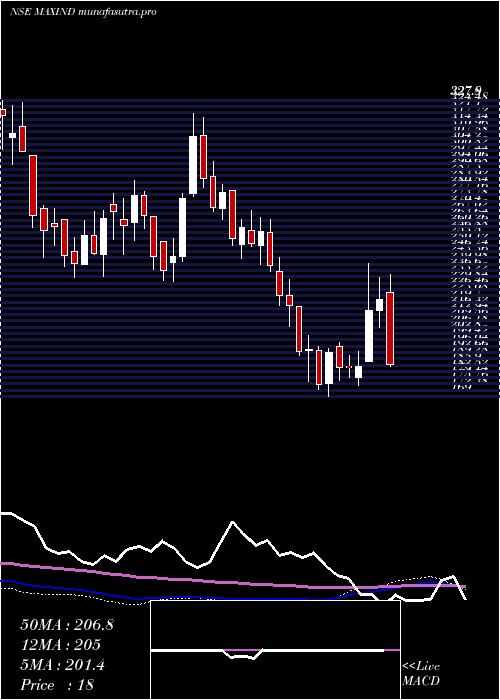
Weekly price and charts MaxIndia Strong weekly Stock price targets for MaxIndia MAXIND are 203.98 and 215.63 | Weekly Target 1 | 201.25 | | Weekly Target 2 | 206.7 | | Weekly Target 3 | 212.9 | | Weekly Target 4 | 218.35 | | Weekly Target 5 | 224.55 |
Weekly price and volumes for Max India
| Date |
Closing |
Open |
Range |
Volume |
Wed 29 October 2025 |
212.15 (-0.49%) |
216.40 |
207.45 - 219.10 |
0.1053 times |
Fri 24 October 2025 |
213.19 (1.73%) |
208.20 |
208.20 - 225.01 |
0.2616 times |
Fri 17 October 2025 |
209.56 (-1.81%) |
213.42 |
207.96 - 216.00 |
0.177 times |
Fri 10 October 2025 |
213.42 (-2.45%) |
218.26 |
208.46 - 219.10 |
0.3298 times |
Fri 03 October 2025 |
218.77 (1.48%) |
214.00 |
209.22 - 228.80 |
0.9883 times |
Fri 26 September 2025 |
215.59 (4.56%) |
206.25 |
200.00 - 241.57 |
7.1145 times |
Fri 19 September 2025 |
206.19 (-5.25%) |
220.80 |
205.55 - 221.51 |
0.2597 times |
Fri 12 September 2025 |
217.62 (-0.66%) |
219.48 |
215.10 - 224.99 |
0.2155 times |
Fri 05 September 2025 |
219.07 (-0.21%) |
218.60 |
215.16 - 226.00 |
0.2818 times |
Fri 29 August 2025 |
219.54 (0.02%) |
221.50 |
213.32 - 226.36 |
0.2666 times |
Fri 22 August 2025 |
219.50 (8.5%) |
202.41 |
202.41 - 222.00 |
0.3366 times |
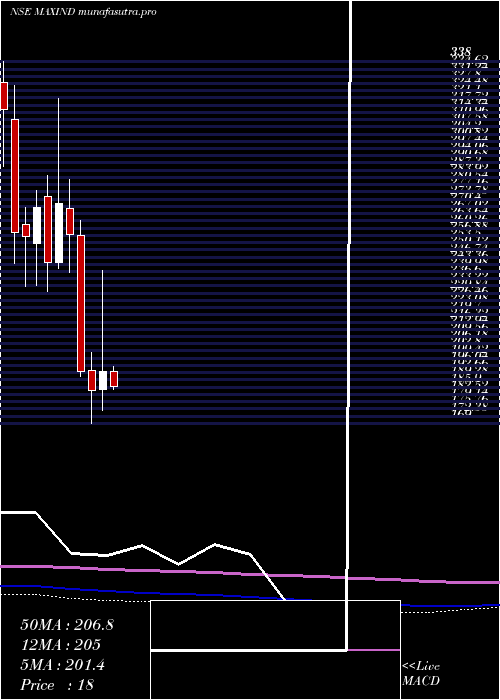
Monthly price and charts MaxIndia Strong monthly Stock price targets for MaxIndia MAXIND are 209.8 and 231.15 | Monthly Target 1 | 194.78 | | Monthly Target 2 | 203.47 | | Monthly Target 3 | 216.13333333333 | | Monthly Target 4 | 224.82 | | Monthly Target 5 | 237.48 |
Monthly price and volumes Max India
| Date |
Closing |
Open |
Range |
Volume |
Wed 29 October 2025 |
212.15 (-0.78%) |
212.00 |
207.45 - 228.80 |
0.5141 times |
Tue 30 September 2025 |
213.81 (-2.61%) |
218.60 |
200.00 - 241.57 |
3.0414 times |
Fri 29 August 2025 |
219.54 (0.74%) |
217.93 |
200.00 - 227.01 |
0.6878 times |
Thu 31 July 2025 |
217.93 (15.69%) |
189.00 |
183.50 - 234.45 |
1.4849 times |
Mon 30 June 2025 |
188.38 (4.16%) |
181.20 |
176.96 - 197.35 |
0.7663 times |
Fri 30 May 2025 |
180.86 (-6.44%) |
193.25 |
169.28 - 200.00 |
0.7262 times |
Wed 30 April 2025 |
193.31 (4.79%) |
185.00 |
174.99 - 240.49 |
1.265 times |
Fri 28 March 2025 |
184.48 (-4.61%) |
193.90 |
169.00 - 202.00 |
0.7503 times |
Fri 28 February 2025 |
193.40 (-24.86%) |
257.00 |
191.00 - 264.00 |
0.3917 times |
Fri 31 January 2025 |
257.40 (-5.24%) |
269.30 |
239.60 - 282.95 |
0.3724 times |
Tue 31 December 2024 |
271.62 (11.18%) |
244.30 |
241.28 - 320.69 |
0.7039 times |
DMA SMA EMA moving averages of Max India MAXIND
DMA (daily moving average) of Max India MAXIND
| DMA period | DMA value | | 5 day DMA | 214.1 | | 12 day DMA | 213.18 | | 20 day DMA | 213.5 | | 35 day DMA | 213.42 | | 50 day DMA | 214.49 | | 100 day DMA | 205.98 | | 150 day DMA | 201.04 | | 200 day DMA | 207.24 | EMA (exponential moving average) of Max India MAXIND
| EMA period | EMA current | EMA prev | EMA prev2 | | 5 day EMA | 213.5 | 214.17 | 215.34 | | 12 day EMA | 213.61 | 213.88 | 214.25 | | 20 day EMA | 213.49 | 213.63 | 213.82 | | 35 day EMA | 213.59 | 213.68 | 213.79 | | 50 day EMA | 213.69 | 213.75 | 213.83 |
SMA (simple moving average) of Max India MAXIND
| SMA period | SMA current | SMA prev | SMA prev2 | | 5 day SMA | 214.1 | 215.43 | 216.18 | | 12 day SMA | 213.18 | 213.29 | 213.22 | | 20 day SMA | 213.5 | 213.64 | 213.83 | | 35 day SMA | 213.42 | 213.54 | 213.75 | | 50 day SMA | 214.49 | 214.29 | 214.2 | | 100 day SMA | 205.98 | 205.69 | 205.39 | | 150 day SMA | 201.04 | 200.9 | 200.76 | | 200 day SMA | 207.24 | 207.51 | 207.77 |
|
|
