MawanaSugars MAWANASUG full analysis,charts,indicators,moving averages,SMA,DMA,EMA,ADX,MACD,RSIMawana Sugars MAWANASUG WideScreen charts, DMA,SMA,EMA technical analysis, forecast prediction, by indicators ADX,MACD,RSI,CCI NSE stock exchange
operates under Sugar sector
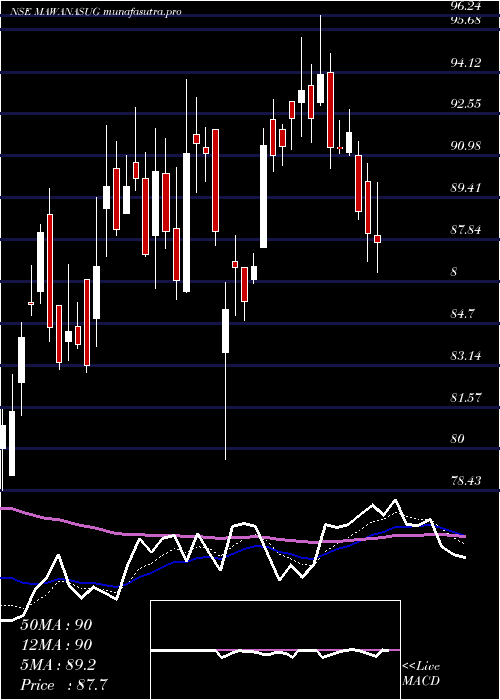
Daily price and charts and targets MawanaSugars Strong Daily Stock price targets for MawanaSugars MAWANASUG are 87.54 and 89.06 | Daily Target 1 | 86.34 | | Daily Target 2 | 87.21 | | Daily Target 3 | 87.856666666667 | | Daily Target 4 | 88.73 | | Daily Target 5 | 89.38 |
Daily price and volume Mawana Sugars
| Date |
Closing |
Open |
Range |
Volume |
Wed 29 October 2025 |
88.09 (0.94%) |
87.70 |
86.98 - 88.50 |
1.199 times |
Tue 28 October 2025 |
87.27 (0.65%) |
87.50 |
86.78 - 87.50 |
1.4913 times |
Mon 27 October 2025 |
86.71 (-0.21%) |
87.90 |
86.05 - 87.90 |
0.5736 times |
Fri 24 October 2025 |
86.89 (-0.45%) |
87.74 |
86.10 - 87.74 |
1.1717 times |
Thu 23 October 2025 |
87.28 (-0.41%) |
87.64 |
87.00 - 88.70 |
1.4547 times |
Tue 21 October 2025 |
87.64 (1.53%) |
88.00 |
86.80 - 88.00 |
0.4977 times |
Mon 20 October 2025 |
86.32 (0.7%) |
87.70 |
85.74 - 87.70 |
0.8738 times |
Fri 17 October 2025 |
85.72 (-1.56%) |
87.05 |
85.10 - 88.00 |
1.1149 times |
Thu 16 October 2025 |
87.08 (0.08%) |
87.40 |
86.30 - 88.00 |
0.9634 times |
Wed 15 October 2025 |
87.01 (2.32%) |
85.05 |
85.05 - 87.89 |
0.66 times |
Tue 14 October 2025 |
85.04 (-4.55%) |
89.10 |
83.30 - 89.91 |
4.5503 times |
Weekly price and charts MawanaSugars Strong weekly Stock price targets for MawanaSugars MAWANASUG are 87.07 and 89.52 | Weekly Target 1 | 85.1 | | Weekly Target 2 | 86.59 | | Weekly Target 3 | 87.546666666667 | | Weekly Target 4 | 89.04 | | Weekly Target 5 | 90 |
Weekly price and volumes for Mawana Sugars
| Date |
Closing |
Open |
Range |
Volume |
Wed 29 October 2025 |
88.09 (1.38%) |
87.90 |
86.05 - 88.50 |
0.5164 times |
Fri 24 October 2025 |
86.89 (1.36%) |
87.70 |
85.74 - 88.70 |
0.6326 times |
Fri 17 October 2025 |
85.72 (-4.99%) |
88.80 |
83.30 - 90.99 |
1.3436 times |
Fri 10 October 2025 |
90.22 (0.82%) |
90.00 |
88.50 - 91.69 |
0.8062 times |
Fri 03 October 2025 |
89.49 (1.66%) |
90.00 |
87.19 - 90.39 |
0.4113 times |
Fri 26 September 2025 |
88.03 (-4.09%) |
91.70 |
87.00 - 93.24 |
0.7291 times |
Fri 19 September 2025 |
91.78 (-0.79%) |
92.69 |
91.16 - 94.80 |
0.7658 times |
Fri 12 September 2025 |
92.51 (-0.54%) |
93.15 |
90.10 - 98.00 |
1.8971 times |
Fri 05 September 2025 |
93.01 (6.12%) |
89.49 |
87.11 - 95.90 |
2.5855 times |
Fri 29 August 2025 |
87.65 (-1.79%) |
89.25 |
86.55 - 90.48 |
0.3123 times |
Fri 22 August 2025 |
89.25 (0.35%) |
89.03 |
87.55 - 92.99 |
0.7882 times |
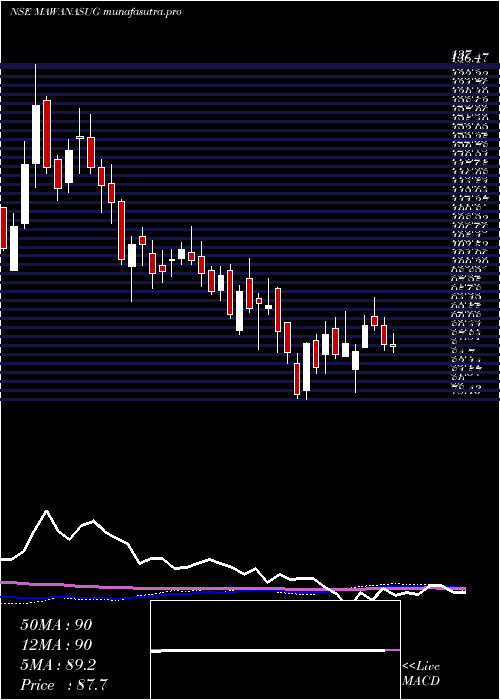
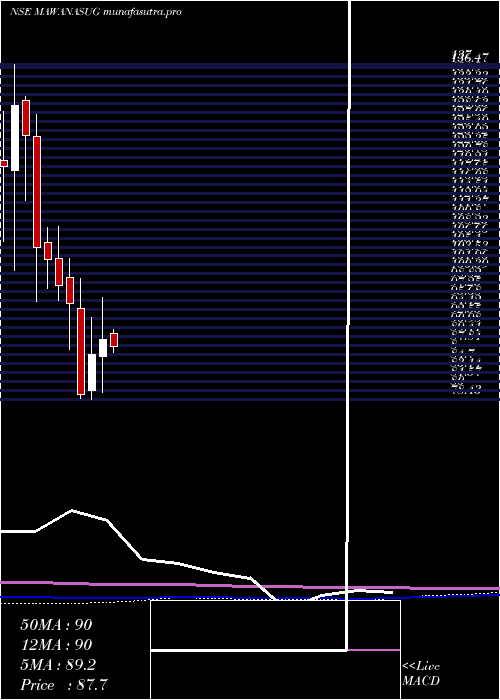
Monthly price and charts MawanaSugars Strong monthly Stock price targets for MawanaSugars MAWANASUG are 85.7 and 94.09 | Monthly Target 1 | 79.3 | | Monthly Target 2 | 83.7 | | Monthly Target 3 | 87.693333333333 | | Monthly Target 4 | 92.09 | | Monthly Target 5 | 96.08 |
Monthly price and volumes Mawana Sugars
| Date |
Closing |
Open |
Range |
Volume |
Wed 29 October 2025 |
88.09 (0.1%) |
88.00 |
83.30 - 91.69 |
0.4951 times |
Tue 30 September 2025 |
88.00 (0.4%) |
89.49 |
87.00 - 98.00 |
0.8692 times |
Fri 29 August 2025 |
87.65 (-8.56%) |
94.05 |
85.50 - 97.16 |
0.5057 times |
Thu 31 July 2025 |
95.85 (-6.41%) |
101.51 |
94.56 - 104.68 |
0.8416 times |
Mon 30 June 2025 |
102.41 (0.95%) |
100.90 |
97.51 - 111.50 |
1.7677 times |
Fri 30 May 2025 |
101.45 (14.13%) |
90.00 |
83.00 - 103.87 |
1.4963 times |
Wed 30 April 2025 |
88.89 (2.99%) |
85.91 |
79.61 - 96.24 |
1.0655 times |
Fri 28 March 2025 |
86.31 (8.81%) |
80.00 |
78.43 - 92.80 |
1.1522 times |
Fri 28 February 2025 |
79.32 (-16.7%) |
94.41 |
78.54 - 99.59 |
0.8869 times |
Fri 31 January 2025 |
95.22 (-3.19%) |
99.68 |
87.11 - 103.00 |
0.9198 times |
Tue 31 December 2024 |
98.36 (-4.48%) |
103.00 |
95.70 - 108.75 |
1.259 times |
DMA SMA EMA moving averages of Mawana Sugars MAWANASUG
DMA (daily moving average) of Mawana Sugars MAWANASUG
| DMA period | DMA value | | 5 day DMA | 87.25 | | 12 day DMA | 87.01 | | 20 day DMA | 88.06 | | 35 day DMA | 89.66 | | 50 day DMA | 89.85 | | 100 day DMA | 94.19 | | 150 day DMA | 93.68 | | 200 day DMA | 92.88 | EMA (exponential moving average) of Mawana Sugars MAWANASUG
| EMA period | EMA current | EMA prev | EMA prev2 | | 5 day EMA | 87.39 | 87.04 | 86.93 | | 12 day EMA | 87.55 | 87.45 | 87.48 | | 20 day EMA | 88.04 | 88.04 | 88.12 | | 35 day EMA | 88.7 | 88.74 | 88.83 | | 50 day EMA | 89.51 | 89.57 | 89.66 |
SMA (simple moving average) of Mawana Sugars MAWANASUG
| SMA period | SMA current | SMA prev | SMA prev2 | | 5 day SMA | 87.25 | 87.16 | 86.97 | | 12 day SMA | 87.01 | 87.19 | 87.44 | | 20 day SMA | 88.06 | 88.08 | 88.12 | | 35 day SMA | 89.66 | 89.73 | 89.89 | | 50 day SMA | 89.85 | 89.87 | 89.91 | | 100 day SMA | 94.19 | 94.39 | 94.57 | | 150 day SMA | 93.68 | 93.69 | 93.7 | | 200 day SMA | 92.88 | 92.93 | 92.98 |
|
|
