MasterComponents MASTER_SM full analysis,charts,indicators,moving averages,SMA,DMA,EMA,ADX,MACD,RSIMaster Components MASTER_SM WideScreen charts, DMA,SMA,EMA technical analysis, forecast prediction, by indicators ADX,MACD,RSI,CCI NSE stock exchange
Daily price and charts and targets MasterComponents Strong Daily Stock price targets for MasterComponents MASTER_SM are 357 and 359 | Daily Target 1 | 356.67 | | Daily Target 2 | 357.33 | | Daily Target 3 | 358.66666666667 | | Daily Target 4 | 359.33 | | Daily Target 5 | 360.67 |
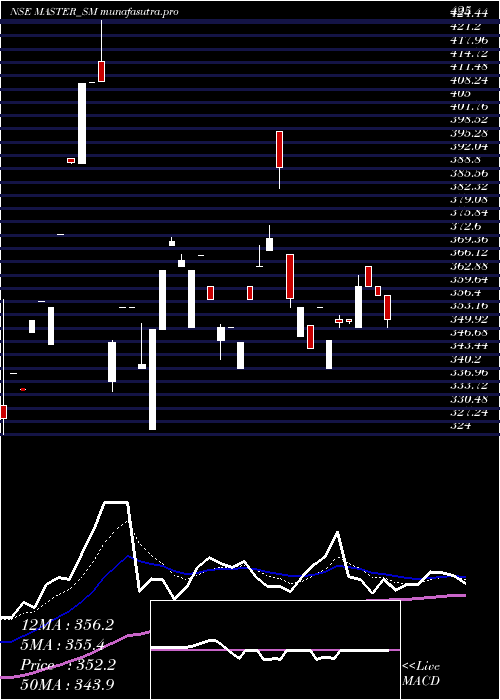
Daily price and volume Master Components
| Date |
Closing |
Open |
Range |
Volume |
Mon 27 October 2025 |
358.00 (-0.56%) |
360.00 |
358.00 - 360.00 |
0.4651 times |
Fri 24 October 2025 |
360.00 (0%) |
365.00 |
360.00 - 365.00 |
0.4651 times |
Thu 23 October 2025 |
360.00 (2.42%) |
350.00 |
350.00 - 362.85 |
1.1628 times |
Tue 21 October 2025 |
351.50 (0.06%) |
352.00 |
351.00 - 352.00 |
0.4651 times |
Mon 20 October 2025 |
351.30 (1.24%) |
352.00 |
350.00 - 353.00 |
2.3256 times |
Fri 17 October 2025 |
347.00 (-2.25%) |
340.00 |
340.00 - 347.00 |
0.4651 times |
Thu 16 October 2025 |
355.00 (2.9%) |
355.00 |
355.00 - 355.00 |
0.2326 times |
Tue 14 October 2025 |
345.00 (-2.82%) |
350.50 |
345.00 - 350.50 |
1.3953 times |
Mon 13 October 2025 |
355.00 (-0.63%) |
348.00 |
348.00 - 355.00 |
0.6977 times |
Thu 09 October 2025 |
357.25 (-8.16%) |
368.00 |
355.00 - 368.00 |
2.3256 times |
Wed 08 October 2025 |
389.00 (4.64%) |
397.95 |
384.00 - 397.95 |
0.9302 times |
Weekly price and charts MasterComponents Strong weekly Stock price targets for MasterComponents MASTER_SM are 357 and 359 | Weekly Target 1 | 356.67 | | Weekly Target 2 | 357.33 | | Weekly Target 3 | 358.66666666667 | | Weekly Target 4 | 359.33 | | Weekly Target 5 | 360.67 |
Weekly price and volumes for Master Components
| Date |
Closing |
Open |
Range |
Volume |
Mon 27 October 2025 |
358.00 (-0.56%) |
360.00 |
358.00 - 360.00 |
0.0985 times |
Fri 24 October 2025 |
360.00 (3.75%) |
352.00 |
350.00 - 365.00 |
0.936 times |
Fri 17 October 2025 |
347.00 (-2.87%) |
348.00 |
340.00 - 355.00 |
0.5911 times |
Thu 09 October 2025 |
357.25 (0.07%) |
365.00 |
355.00 - 397.95 |
1.2808 times |
Fri 03 October 2025 |
357.00 (2%) |
350.00 |
340.00 - 360.00 |
0.3941 times |
Thu 25 September 2025 |
350.00 (-4.5%) |
350.00 |
342.25 - 367.65 |
1.2315 times |
Fri 19 September 2025 |
366.50 (3.24%) |
340.00 |
325.15 - 372.00 |
1.33 times |
Wed 10 September 2025 |
355.00 (-13.45%) |
337.00 |
334.50 - 355.00 |
0.6404 times |
Fri 16 May 2025 |
410.15 (15.54%) |
372.75 |
372.75 - 425.00 |
3.0542 times |
Fri 09 May 2025 |
355.00 (8.28%) |
339.00 |
335.00 - 356.50 |
0.4433 times |
Fri 02 May 2025 |
327.85 (-3.86%) |
341.00 |
324.00 - 356.90 |
0.5419 times |

Monthly price and charts MasterComponents Strong monthly Stock price targets for MasterComponents MASTER_SM are 320.03 and 377.98 | Monthly Target 1 | 307.37 | | Monthly Target 2 | 332.68 | | Monthly Target 3 | 365.31666666667 | | Monthly Target 4 | 390.63 | | Monthly Target 5 | 423.27 |
Monthly price and volumes Master Components
| Date |
Closing |
Open |
Range |
Volume |
Mon 27 October 2025 |
358.00 (3.32%) |
360.00 |
340.00 - 397.95 |
0.4851 times |
Tue 30 September 2025 |
346.50 (-15.52%) |
337.00 |
325.15 - 372.00 |
0.5477 times |
Fri 16 May 2025 |
410.15 (20.28%) |
331.00 |
324.00 - 425.00 |
0.6338 times |
Mon 28 April 2025 |
341.00 (20.28%) |
286.00 |
272.20 - 341.00 |
0.1721 times |
Fri 21 March 2025 |
283.50 (6.98%) |
271.00 |
265.00 - 295.00 |
0.1095 times |
Fri 28 February 2025 |
265.00 (-11.36%) |
300.00 |
258.40 - 300.00 |
0.2113 times |
Tue 28 January 2025 |
298.95 (3.09%) |
307.00 |
283.75 - 322.00 |
1.9249 times |
Tue 08 October 2024 |
290.00 (-12.12%) |
290.00 |
290.00 - 290.00 |
0.0156 times |
Fri 12 July 2024 |
330.00 (5.43%) |
313.00 |
302.00 - 360.00 |
0.7825 times |
Fri 28 June 2024 |
313.00 (56.5%) |
196.70 |
171.50 - 374.75 |
5.1174 times |
Fri 31 May 2024 |
200.00 (37.79%) |
148.00 |
140.15 - 235.00 |
2.8169 times |

DMA SMA EMA moving averages of Master Components MASTER_SM
DMA (daily moving average) of Master Components MASTER_SM
| DMA period | DMA value | | 5 day DMA | 356.16 | | 12 day DMA | 358.4 | | 20 day DMA | 357.9 | | 35 day DMA | 363.16 | | 50 day DMA | 347.29 | | 100 day DMA | 316.3 | | 150 day DMA | 261.44 | | 200 day DMA | 231.4 | EMA (exponential moving average) of Master Components MASTER_SM
| EMA period | EMA current | EMA prev | EMA prev2 | | 5 day EMA | 357.02 | 356.53 | 354.79 | | 12 day EMA | 356.93 | 356.73 | 356.13 | | 20 day EMA | 356.45 | 356.29 | 355.9 | | 35 day EMA | 348.87 | 348.33 | 347.64 | | 50 day EMA | 342.11 | 341.46 | 340.7 |
SMA (simple moving average) of Master Components MASTER_SM
| SMA period | SMA current | SMA prev | SMA prev2 | | 5 day SMA | 356.16 | 353.96 | 352.96 | | 12 day SMA | 358.4 | 358.98 | 358.73 | | 20 day SMA | 357.9 | 358.32 | 358.87 | | 35 day SMA | 363.16 | 362.98 | 362.27 | | 50 day SMA | 347.29 | 345.55 | 344.05 | | 100 day SMA | 316.3 | 314.83 | 313.53 | | 150 day SMA | 261.44 | 259.99 | 258.55 | | 200 day SMA | 231.4 | 230.34 | 229.25 |
|
|
