MiraeamcMasptop50 MASPTOP50 full analysis,charts,indicators,moving averages,SMA,DMA,EMA,ADX,MACD,RSIMiraeamc Masptop50 MASPTOP50 WideScreen charts, DMA,SMA,EMA technical analysis, forecast prediction, by indicators ADX,MACD,RSI,CCI NSE stock exchange
Daily price and charts and targets MiraeamcMasptop50 Strong Daily Stock price targets for MiraeamcMasptop50 MASPTOP50 are 69.21 and 69.21 | Daily Target 1 | 69.21 | | Daily Target 2 | 69.21 | | Daily Target 3 | 69.21 | | Daily Target 4 | 69.21 | | Daily Target 5 | 69.21 |
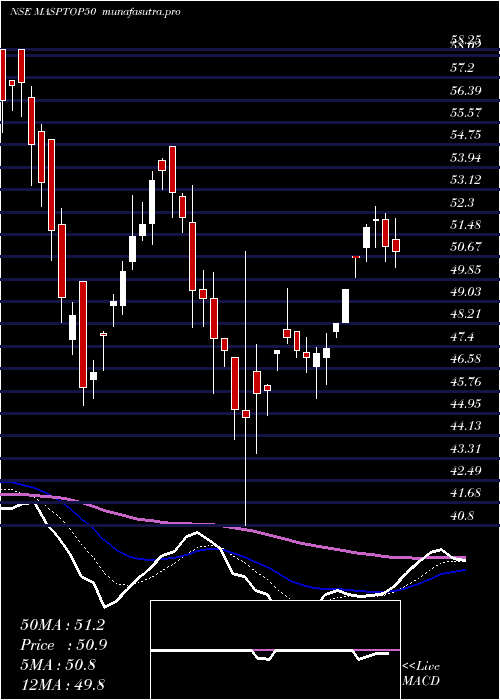
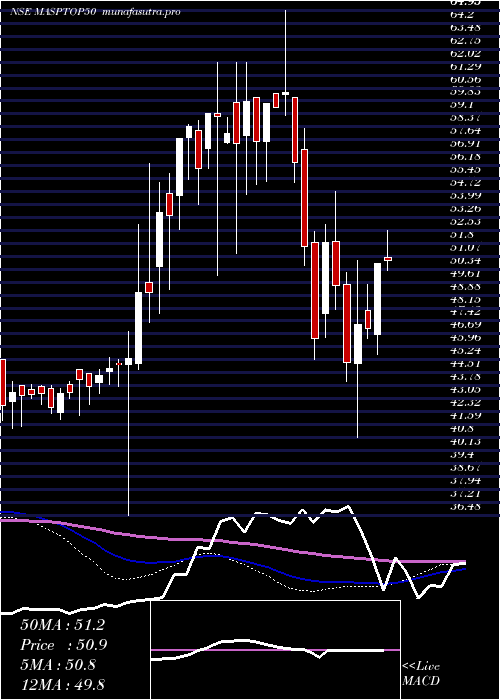
Daily price and volume Miraeamc Masptop50
| Date |
Closing |
Open |
Range |
Volume |
Tue 28 October 2025 |
69.21 (0.77%) |
69.21 |
69.21 - 69.21 |
0.7698 times |
Mon 27 October 2025 |
68.68 (-0.04%) |
68.68 |
68.68 - 68.68 |
1.1456 times |
Fri 24 October 2025 |
68.71 (0.1%) |
68.72 |
67.22 - 68.72 |
0.5147 times |
Thu 23 October 2025 |
68.64 (0.85%) |
68.72 |
67.10 - 68.72 |
1.5533 times |
Tue 21 October 2025 |
68.06 (0.56%) |
68.06 |
68.06 - 68.06 |
0.0826 times |
Mon 20 October 2025 |
67.68 (-0.53%) |
67.68 |
67.68 - 67.68 |
0.3484 times |
Fri 17 October 2025 |
68.04 (-0.32%) |
68.25 |
65.60 - 68.25 |
0.7065 times |
Thu 16 October 2025 |
68.26 (0.35%) |
68.26 |
67.85 - 68.26 |
0.8195 times |
Wed 15 October 2025 |
68.02 (0.92%) |
68.72 |
67.86 - 68.72 |
1.8877 times |
Tue 14 October 2025 |
67.40 (-2.03%) |
67.41 |
67.35 - 67.41 |
2.172 times |
Mon 13 October 2025 |
68.80 (-1.02%) |
69.55 |
68.02 - 69.55 |
2.1036 times |
Weekly price and charts MiraeamcMasptop50 Strong weekly Stock price targets for MiraeamcMasptop50 MASPTOP50 are 68.95 and 69.48 | Weekly Target 1 | 68.5 | | Weekly Target 2 | 68.86 | | Weekly Target 3 | 69.033333333333 | | Weekly Target 4 | 69.39 | | Weekly Target 5 | 69.56 |
Weekly price and volumes for Miraeamc Masptop50
| Date |
Closing |
Open |
Range |
Volume |
Tue 28 October 2025 |
69.21 (0.73%) |
68.68 |
68.68 - 69.21 |
0.575 times |
Fri 24 October 2025 |
68.71 (0.98%) |
67.68 |
67.10 - 68.72 |
0.7502 times |
Fri 17 October 2025 |
68.04 (-2.11%) |
69.55 |
65.60 - 69.55 |
2.3084 times |
Fri 10 October 2025 |
69.51 (1.13%) |
67.01 |
67.01 - 69.51 |
1.3217 times |
Fri 03 October 2025 |
68.73 (0.63%) |
67.95 |
66.52 - 68.73 |
0.4034 times |
Fri 26 September 2025 |
68.30 (1.64%) |
67.64 |
67.64 - 68.66 |
1.1019 times |
Fri 19 September 2025 |
67.20 (1.04%) |
66.92 |
66.92 - 67.77 |
0.7036 times |
Fri 12 September 2025 |
66.51 (1.96%) |
65.85 |
65.23 - 66.51 |
0.8948 times |
Fri 05 September 2025 |
65.23 (0.59%) |
63.22 |
63.19 - 66.99 |
1.1308 times |
Fri 29 August 2025 |
64.85 (3.17%) |
63.14 |
62.69 - 64.86 |
0.8102 times |
Fri 22 August 2025 |
62.86 (-3.07%) |
63.22 |
62.42 - 64.95 |
1.2961 times |
Monthly price and charts MiraeamcMasptop50 Strong monthly Stock price targets for MiraeamcMasptop50 MASPTOP50 are 67.41 and 71.36 | Monthly Target 1 | 64.17 | | Monthly Target 2 | 66.69 | | Monthly Target 3 | 68.12 | | Monthly Target 4 | 70.64 | | Monthly Target 5 | 72.07 |
Monthly price and volumes Miraeamc Masptop50
| Date |
Closing |
Open |
Range |
Volume |
Tue 28 October 2025 |
69.21 (1.44%) |
66.52 |
65.60 - 69.55 |
0.6651 times |
Tue 30 September 2025 |
68.23 (5.21%) |
63.22 |
63.19 - 68.66 |
0.516 times |
Fri 29 August 2025 |
64.85 (3.31%) |
62.10 |
60.33 - 64.95 |
0.8714 times |
Thu 31 July 2025 |
62.77 (13.82%) |
54.16 |
53.94 - 62.82 |
1.5799 times |
Mon 30 June 2025 |
55.15 (1.96%) |
54.86 |
52.52 - 56.30 |
0.7415 times |
Fri 30 May 2025 |
54.09 (5.93%) |
51.29 |
50.10 - 56.53 |
1.1152 times |
Wed 30 April 2025 |
51.06 (3.28%) |
49.48 |
40.86 - 52.50 |
1.7774 times |
Fri 28 March 2025 |
49.44 (-12.29%) |
57.10 |
45.25 - 58.25 |
1.4401 times |
Fri 28 February 2025 |
56.37 (-2.05%) |
57.55 |
55.21 - 64.95 |
0.4463 times |
Fri 31 January 2025 |
57.55 (-1.3%) |
57.51 |
51.25 - 61.99 |
0.8472 times |
Tue 31 December 2024 |
58.31 (9.28%) |
54.50 |
50.00 - 59.13 |
0.7909 times |
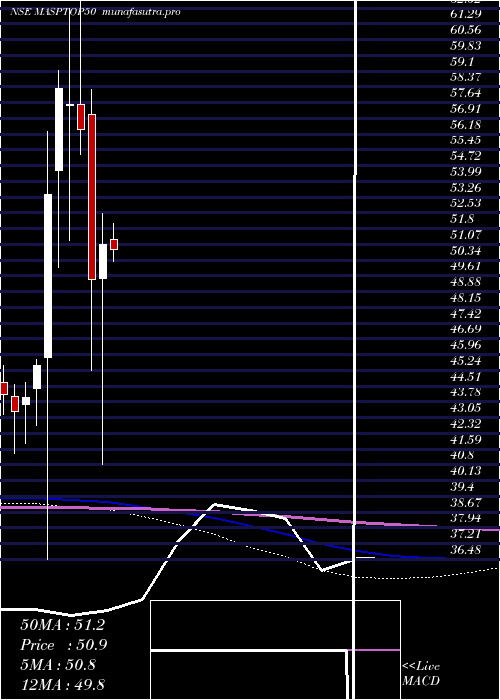
DMA SMA EMA moving averages of Miraeamc Masptop50 MASPTOP50
DMA (daily moving average) of Miraeamc Masptop50 MASPTOP50
| DMA period | DMA value | | 5 day DMA | 68.66 | | 12 day DMA | 68.42 | | 20 day DMA | 68.5 | | 35 day DMA | 67.95 | | 50 day DMA | 66.92 | | 100 day DMA | 62.33 | | 150 day DMA | 58.63 | | 200 day DMA | 58.18 | EMA (exponential moving average) of Miraeamc Masptop50 MASPTOP50
| EMA period | EMA current | EMA prev | EMA prev2 | | 5 day EMA | 68.73 | 68.49 | 68.4 | | 12 day EMA | 68.51 | 68.38 | 68.33 | | 20 day EMA | 68.29 | 68.19 | 68.14 | | 35 day EMA | 67.55 | 67.45 | 67.38 | | 50 day EMA | 66.79 | 66.69 | 66.61 |
SMA (simple moving average) of Miraeamc Masptop50 MASPTOP50
| SMA period | SMA current | SMA prev | SMA prev2 | | 5 day SMA | 68.66 | 68.35 | 68.23 | | 12 day SMA | 68.42 | 68.4 | 68.43 | | 20 day SMA | 68.5 | 68.46 | 68.45 | | 35 day SMA | 67.95 | 67.84 | 67.72 | | 50 day SMA | 66.92 | 66.8 | 66.71 | | 100 day SMA | 62.33 | 62.17 | 62.03 | | 150 day SMA | 58.63 | 58.5 | 58.37 | | 200 day SMA | 58.18 | 58.12 | 58.07 |
|
|
