MasonInfratech MASON_SM full analysis,charts,indicators,moving averages,SMA,DMA,EMA,ADX,MACD,RSIMason Infratech MASON_SM WideScreen charts, DMA,SMA,EMA technical analysis, forecast prediction, by indicators ADX,MACD,RSI,CCI NSE stock exchange
Daily price and charts and targets MasonInfratech Strong Daily Stock price targets for MasonInfratech MASON_SM are 201.78 and 205.23 | Daily Target 1 | 200.7 | | Daily Target 2 | 202.85 | | Daily Target 3 | 204.15 | | Daily Target 4 | 206.3 | | Daily Target 5 | 207.6 |
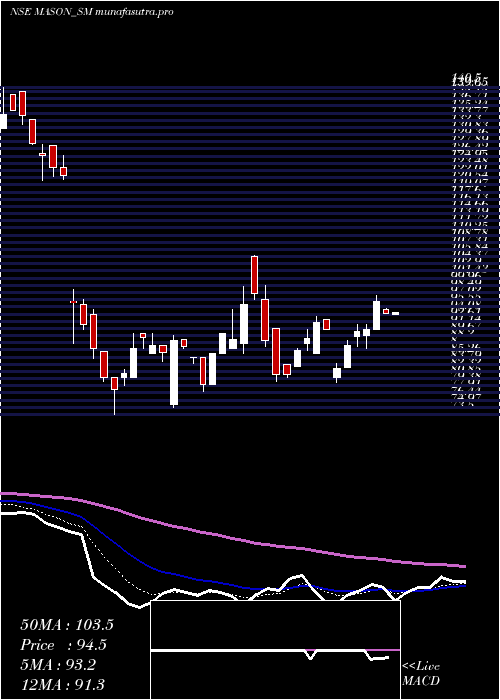
Daily price and volume Mason Infratech
| Date |
Closing |
Open |
Range |
Volume |
Tue 28 October 2025 |
205.00 (1.23%) |
205.45 |
202.00 - 205.45 |
0.7767 times |
Mon 27 October 2025 |
202.50 (0.42%) |
201.65 |
201.65 - 206.50 |
0.9709 times |
Fri 24 October 2025 |
201.65 (0.07%) |
204.65 |
201.65 - 204.65 |
0.1942 times |
Thu 23 October 2025 |
201.50 (-1.97%) |
202.25 |
201.50 - 202.25 |
0.4854 times |
Tue 21 October 2025 |
205.55 (0.17%) |
205.20 |
204.10 - 207.00 |
1.5534 times |
Mon 20 October 2025 |
205.20 (1.94%) |
205.50 |
202.25 - 205.50 |
1.6505 times |
Fri 17 October 2025 |
201.30 (1.85%) |
205.00 |
201.30 - 206.50 |
1.068 times |
Thu 16 October 2025 |
197.65 (-1.05%) |
200.00 |
197.30 - 203.40 |
1.068 times |
Wed 15 October 2025 |
199.75 (1.91%) |
198.80 |
197.70 - 199.75 |
0.7767 times |
Tue 14 October 2025 |
196.00 (-1.66%) |
198.35 |
195.00 - 201.00 |
1.4563 times |
Mon 13 October 2025 |
199.30 (59.25%) |
176.05 |
176.05 - 202.85 |
2.9126 times |
Weekly price and charts MasonInfratech Strong weekly Stock price targets for MasonInfratech MASON_SM are 203.33 and 208.18 | Weekly Target 1 | 199.53 | | Weekly Target 2 | 202.27 | | Weekly Target 3 | 204.38333333333 | | Weekly Target 4 | 207.12 | | Weekly Target 5 | 209.23 |
Weekly price and volumes for Mason Infratech
| Date |
Closing |
Open |
Range |
Volume |
Tue 28 October 2025 |
205.00 (1.66%) |
201.65 |
201.65 - 206.50 |
0.1122 times |
Fri 24 October 2025 |
201.65 (0.17%) |
205.50 |
201.50 - 207.00 |
0.2494 times |
Fri 17 October 2025 |
201.30 (60.85%) |
176.05 |
176.05 - 206.50 |
0.4676 times |
Mon 19 May 2025 |
125.15 (0.16%) |
128.80 |
122.75 - 128.85 |
0.3429 times |
Fri 16 May 2025 |
124.95 (27.5%) |
102.00 |
102.00 - 135.00 |
5.4364 times |
Fri 09 May 2025 |
98.00 (-5.08%) |
104.20 |
95.20 - 105.95 |
0.8354 times |
Fri 02 May 2025 |
103.25 (2.94%) |
100.00 |
100.00 - 112.85 |
0.9102 times |
Fri 25 April 2025 |
100.30 (6.14%) |
94.55 |
94.55 - 106.55 |
0.6858 times |
Thu 17 April 2025 |
94.50 (3.85%) |
91.00 |
91.00 - 97.90 |
0.2244 times |
Fri 11 April 2025 |
91.00 (0%) |
81.00 |
80.00 - 92.00 |
0.7357 times |
Fri 04 April 2025 |
91.00 (11.52%) |
83.40 |
83.40 - 93.50 |
0.4676 times |

Monthly price and charts MasonInfratech Strong monthly Stock price targets for MasonInfratech MASON_SM are 190.53 and 221.48 | Monthly Target 1 | 165.07 | | Monthly Target 2 | 185.03 | | Monthly Target 3 | 196.01666666667 | | Monthly Target 4 | 215.98 | | Monthly Target 5 | 226.97 |
Monthly price and volumes Mason Infratech
| Date |
Closing |
Open |
Range |
Volume |
Tue 28 October 2025 |
205.00 (63.8%) |
176.05 |
176.05 - 207.00 |
0.0726 times |
Mon 19 May 2025 |
125.15 (20.16%) |
105.00 |
95.20 - 135.00 |
0.597 times |
Wed 30 April 2025 |
104.15 (27.63%) |
83.40 |
80.00 - 112.85 |
0.2467 times |
Fri 28 March 2025 |
81.60 (0.62%) |
81.10 |
73.50 - 106.00 |
0.3623 times |
Fri 28 February 2025 |
81.10 (-33.77%) |
96.60 |
80.25 - 99.05 |
0.0671 times |
Thu 21 November 2024 |
122.45 (-15.17%) |
145.00 |
121.40 - 149.75 |
0.233 times |
Thu 31 October 2024 |
144.35 (-1.64%) |
146.50 |
126.50 - 157.75 |
0.836 times |
Mon 30 September 2024 |
146.75 (-21.4%) |
194.00 |
143.00 - 194.00 |
0.8153 times |
Fri 30 August 2024 |
186.70 (23.97%) |
154.50 |
128.10 - 218.75 |
3.4041 times |
Wed 31 July 2024 |
150.60 (0%) |
128.00 |
126.05 - 179.95 |
3.3659 times |
Tue 28 October 2025 |
(0%) |
|
- |
0 times |

DMA SMA EMA moving averages of Mason Infratech MASON_SM
DMA (daily moving average) of Mason Infratech MASON_SM
| DMA period | DMA value | | 5 day DMA | 203.24 | | 12 day DMA | 195.05 | | 20 day DMA | 161.58 | | 35 day DMA | 134.7 | | 50 day DMA | 120.69 | | 100 day DMA | 124.1 | | 150 day DMA | 134.52 | | 200 day DMA | | EMA (exponential moving average) of Mason Infratech MASON_SM
| EMA period | EMA current | EMA prev | EMA prev2 | | 5 day EMA | 202.24 | 200.86 | 200.04 | | 12 day EMA | 188.13 | 185.06 | 181.89 | | 20 day EMA | 170.73 | 167.12 | 163.4 | | 35 day EMA | 148.21 | 144.87 | 141.48 | | 50 day EMA | 126.14 | 122.92 | 119.67 |
SMA (simple moving average) of Mason Infratech MASON_SM
| SMA period | SMA current | SMA prev | SMA prev2 | | 5 day SMA | 203.24 | 203.28 | 203.04 | | 12 day SMA | 195.05 | 188.38 | 181.56 | | 20 day SMA | 161.58 | 156.28 | 151.03 | | 35 day SMA | 134.7 | 131.34 | 127.93 | | 50 day SMA | 120.69 | 118.3 | 116 | | 100 day SMA | 124.1 | 123.54 | 123.02 | | 150 day SMA | 134.52 | | 200 day SMA |
|
|
