MasFinancial MASFIN full analysis,charts,indicators,moving averages,SMA,DMA,EMA,ADX,MACD,RSIMas Financial MASFIN WideScreen charts, DMA,SMA,EMA technical analysis, forecast prediction, by indicators ADX,MACD,RSI,CCI NSE stock exchange
Daily price and charts and targets MasFinancial Strong Daily Stock price targets for MasFinancial MASFIN are 299 and 302.7 | Daily Target 1 | 298.1 | | Daily Target 2 | 299.9 | | Daily Target 3 | 301.8 | | Daily Target 4 | 303.6 | | Daily Target 5 | 305.5 |
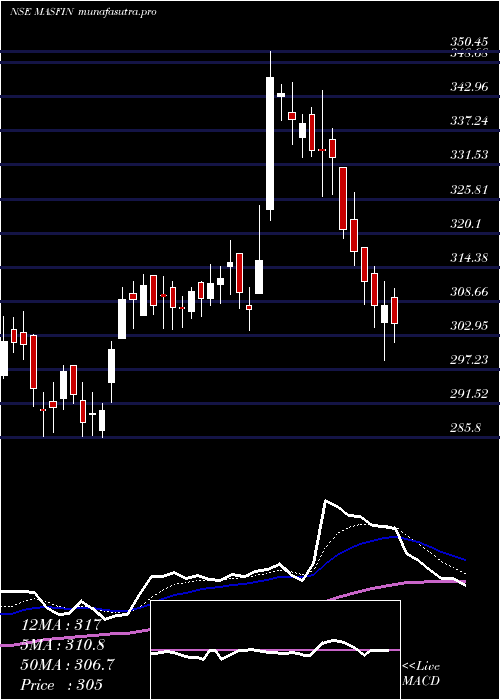
Daily price and volume Mas Financial
| Date |
Closing |
Open |
Range |
Volume |
Tue 28 October 2025 |
301.70 (0.1%) |
302.70 |
300.00 - 303.70 |
0.3349 times |
Mon 27 October 2025 |
301.40 (-2.21%) |
308.00 |
299.50 - 311.00 |
1.8678 times |
Fri 24 October 2025 |
308.20 (0.36%) |
305.95 |
303.00 - 309.45 |
0.6968 times |
Thu 23 October 2025 |
307.10 (-0.32%) |
309.95 |
306.00 - 314.00 |
1.8963 times |
Tue 21 October 2025 |
308.10 (1.52%) |
310.90 |
304.65 - 310.90 |
0.3565 times |
Mon 20 October 2025 |
303.50 (2.05%) |
301.00 |
296.40 - 304.50 |
0.9705 times |
Fri 17 October 2025 |
297.40 (-1.8%) |
304.40 |
293.50 - 304.40 |
1.5674 times |
Thu 16 October 2025 |
302.85 (0.58%) |
299.20 |
296.00 - 305.80 |
0.5209 times |
Wed 15 October 2025 |
301.10 (0.5%) |
301.20 |
296.50 - 302.15 |
0.8578 times |
Tue 14 October 2025 |
299.60 (-0.75%) |
304.95 |
295.00 - 304.95 |
0.9311 times |
Mon 13 October 2025 |
301.85 (-0.97%) |
302.95 |
299.30 - 304.00 |
0.4898 times |
Weekly price and charts MasFinancial Strong weekly Stock price targets for MasFinancial MASFIN are 294.85 and 306.35 | Weekly Target 1 | 292.57 | | Weekly Target 2 | 297.13 | | Weekly Target 3 | 304.06666666667 | | Weekly Target 4 | 308.63 | | Weekly Target 5 | 315.57 |
Weekly price and volumes for Mas Financial
| Date |
Closing |
Open |
Range |
Volume |
Tue 28 October 2025 |
301.70 (-2.11%) |
308.00 |
299.50 - 311.00 |
0.4658 times |
Fri 24 October 2025 |
308.20 (3.63%) |
301.00 |
296.40 - 314.00 |
0.8289 times |
Fri 17 October 2025 |
297.40 (-2.43%) |
302.95 |
293.50 - 305.80 |
0.9234 times |
Fri 10 October 2025 |
304.80 (0.33%) |
301.00 |
299.00 - 312.35 |
1.0028 times |
Fri 03 October 2025 |
303.80 (0.38%) |
307.20 |
295.25 - 313.00 |
1.1292 times |
Fri 26 September 2025 |
302.65 (-4.03%) |
320.00 |
300.15 - 320.00 |
1.5262 times |
Fri 19 September 2025 |
315.35 (-2.29%) |
322.75 |
311.50 - 323.95 |
0.9233 times |
Fri 12 September 2025 |
322.75 (3.86%) |
309.50 |
308.55 - 324.50 |
1.0256 times |
Fri 05 September 2025 |
310.75 (0.21%) |
308.00 |
303.25 - 319.20 |
0.9441 times |
Fri 29 August 2025 |
310.10 (-1.21%) |
317.00 |
302.60 - 322.00 |
1.2307 times |
Fri 22 August 2025 |
313.90 (4.46%) |
306.85 |
304.90 - 321.70 |
1.477 times |

Monthly price and charts MasFinancial Strong monthly Stock price targets for MasFinancial MASFIN are 297.6 and 318.1 | Monthly Target 1 | 282.57 | | Monthly Target 2 | 292.13 | | Monthly Target 3 | 303.06666666667 | | Monthly Target 4 | 312.63 | | Monthly Target 5 | 323.57 |
Monthly price and volumes Mas Financial
| Date |
Closing |
Open |
Range |
Volume |
Tue 28 October 2025 |
301.70 (-0.07%) |
301.40 |
293.50 - 314.00 |
0.4648 times |
Tue 30 September 2025 |
301.90 (-2.64%) |
308.00 |
295.25 - 324.50 |
0.5822 times |
Fri 29 August 2025 |
310.10 (0.67%) |
309.25 |
295.55 - 322.00 |
0.6097 times |
Thu 31 July 2025 |
308.05 (0%) |
309.70 |
298.85 - 350.45 |
1.8316 times |
Mon 30 June 2025 |
308.05 (4.6%) |
292.00 |
283.25 - 313.15 |
1.0837 times |
Fri 30 May 2025 |
294.50 (10.02%) |
271.70 |
253.95 - 297.65 |
1.9423 times |
Wed 30 April 2025 |
267.69 (8.79%) |
246.06 |
226.00 - 288.00 |
0.801 times |
Fri 28 March 2025 |
246.06 (5.36%) |
234.80 |
220.06 - 268.33 |
0.8391 times |
Fri 28 February 2025 |
233.55 (-7.98%) |
251.45 |
231.05 - 263.50 |
0.5097 times |
Fri 31 January 2025 |
253.80 (-7.81%) |
272.80 |
229.40 - 274.60 |
1.336 times |
Tue 31 December 2024 |
275.30 (-0.88%) |
280.00 |
240.00 - 286.80 |
1.1891 times |

DMA SMA EMA moving averages of Mas Financial MASFIN
DMA (daily moving average) of Mas Financial MASFIN
| DMA period | DMA value | | 5 day DMA | 305.3 | | 12 day DMA | 303.13 | | 20 day DMA | 303.65 | | 35 day DMA | 308.5 | | 50 day DMA | 308.93 | | 100 day DMA | 308.89 | | 150 day DMA | 296.11 | | 200 day DMA | 283.54 | EMA (exponential moving average) of Mas Financial MASFIN
| EMA period | EMA current | EMA prev | EMA prev2 | | 5 day EMA | 303.53 | 304.45 | 305.98 | | 12 day EMA | 303.98 | 304.39 | 304.93 | | 20 day EMA | 304.84 | 305.17 | 305.57 | | 35 day EMA | 306.04 | 306.3 | 306.59 | | 50 day EMA | 308.13 | 308.39 | 308.67 |
SMA (simple moving average) of Mas Financial MASFIN
| SMA period | SMA current | SMA prev | SMA prev2 | | 5 day SMA | 305.3 | 305.66 | 304.86 | | 12 day SMA | 303.13 | 303.09 | 303.31 | | 20 day SMA | 303.65 | 303.7 | 304.07 | | 35 day SMA | 308.5 | 308.76 | 309.03 | | 50 day SMA | 308.93 | 309.06 | 309.13 | | 100 day SMA | 308.89 | 308.75 | 308.65 | | 150 day SMA | 296.11 | 295.73 | 295.35 | | 200 day SMA | 283.54 | 283.31 | 283.14 |
|
|
