CE MAPMYINDIA full analysis,charts,indicators,moving averages,SMA,DMA,EMA,ADX,MACD,RSIC E MAPMYINDIA WideScreen charts, DMA,SMA,EMA technical analysis, forecast prediction, by indicators ADX,MACD,RSI,CCI NSE stock exchange
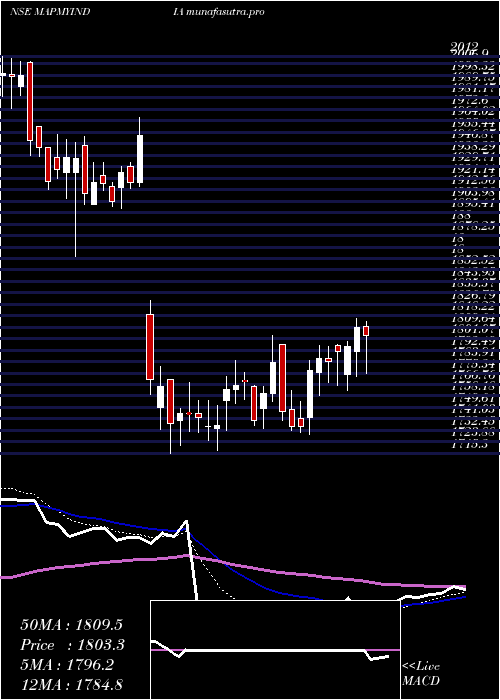
Daily price and charts and targets CE Strong Daily Stock price targets for CE MAPMYINDIA are 1802.65 and 1830.15 | Daily Target 1 | 1780.53 | | Daily Target 2 | 1797.27 | | Daily Target 3 | 1808.0333333333 | | Daily Target 4 | 1824.77 | | Daily Target 5 | 1835.53 |
Daily price and volume C E
| Date |
Closing |
Open |
Range |
Volume |
Tue 28 October 2025 |
1814.00 (0.49%) |
1804.10 |
1791.30 - 1818.80 |
0.1786 times |
Mon 27 October 2025 |
1805.10 (-0.88%) |
1830.80 |
1800.00 - 1840.10 |
0.1247 times |
Fri 24 October 2025 |
1821.20 (0.54%) |
1810.00 |
1802.00 - 1829.90 |
0.1335 times |
Thu 23 October 2025 |
1811.50 (-2.04%) |
1844.00 |
1803.10 - 1845.50 |
0.1968 times |
Tue 21 October 2025 |
1849.30 (0.46%) |
1839.00 |
1830.10 - 1868.00 |
0.0882 times |
Mon 20 October 2025 |
1840.80 (-0.21%) |
1833.00 |
1803.00 - 1851.30 |
0.2537 times |
Fri 17 October 2025 |
1844.70 (-0.18%) |
1854.00 |
1780.00 - 1854.10 |
0.7208 times |
Thu 16 October 2025 |
1848.10 (-1.1%) |
1868.70 |
1829.00 - 1868.70 |
0.5735 times |
Wed 15 October 2025 |
1868.70 (-4.13%) |
1970.10 |
1858.90 - 1976.30 |
1.806 times |
Tue 14 October 2025 |
1949.20 (8.97%) |
1788.00 |
1782.20 - 1998.00 |
5.9244 times |
Mon 13 October 2025 |
1788.80 (4.98%) |
1730.40 |
1721.00 - 1888.00 |
8.144 times |
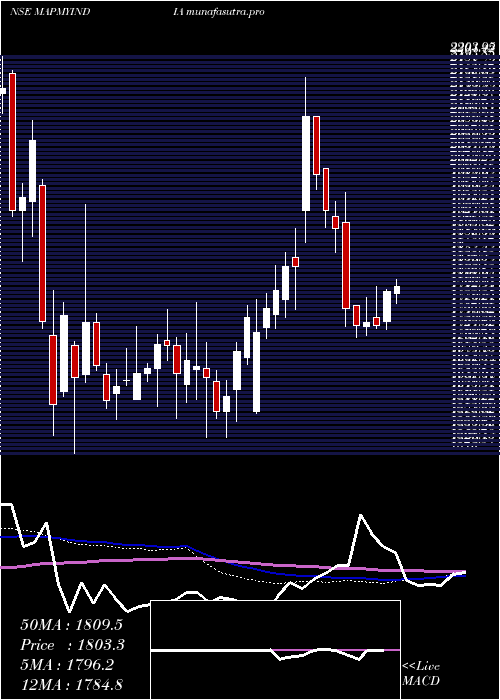
Weekly price and charts CE Strong weekly Stock price targets for CE MAPMYINDIA are 1778.25 and 1827.05 | Weekly Target 1 | 1766.33 | | Weekly Target 2 | 1790.17 | | Weekly Target 3 | 1815.1333333333 | | Weekly Target 4 | 1838.97 | | Weekly Target 5 | 1863.93 |
Weekly price and volumes for C E
| Date |
Closing |
Open |
Range |
Volume |
Tue 28 October 2025 |
1814.00 (-0.4%) |
1830.80 |
1791.30 - 1840.10 |
0.1408 times |
Fri 24 October 2025 |
1821.20 (-1.27%) |
1833.00 |
1802.00 - 1868.00 |
0.312 times |
Fri 17 October 2025 |
1844.70 (8.26%) |
1730.40 |
1721.00 - 1998.00 |
7.97 times |
Fri 10 October 2025 |
1704.00 (2.1%) |
1679.90 |
1656.00 - 1721.20 |
0.2421 times |
Fri 03 October 2025 |
1669.00 (2.86%) |
1622.00 |
1600.10 - 1675.00 |
0.2291 times |
Fri 26 September 2025 |
1622.60 (-1.43%) |
1647.60 |
1602.00 - 1649.60 |
0.1935 times |
Fri 19 September 2025 |
1646.20 (0.7%) |
1644.90 |
1630.80 - 1666.00 |
0.2355 times |
Fri 12 September 2025 |
1634.80 (-0.88%) |
1650.00 |
1631.10 - 1658.60 |
0.1803 times |
Fri 05 September 2025 |
1649.30 (0.37%) |
1650.00 |
1627.00 - 1661.90 |
0.2029 times |
Fri 29 August 2025 |
1643.30 (-4.99%) |
1730.00 |
1627.00 - 1731.30 |
0.2938 times |
Fri 22 August 2025 |
1729.60 (-2.84%) |
1791.80 |
1725.00 - 1792.90 |
0.2356 times |
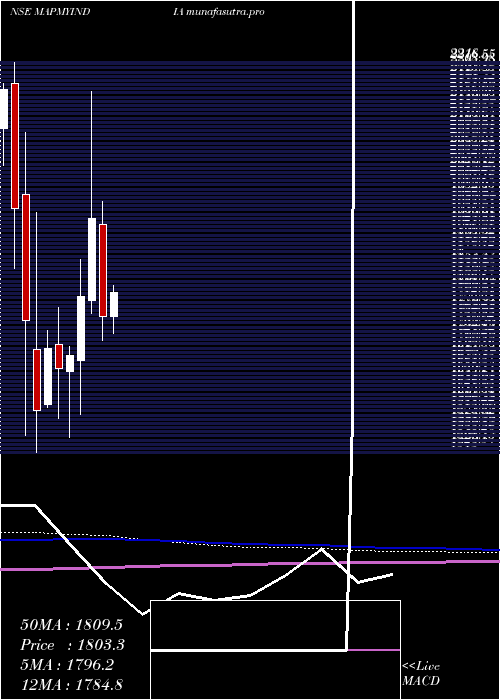
Monthly price and charts CE Strong monthly Stock price targets for CE MAPMYINDIA are 1714.5 and 2097.5 | Monthly Target 1 | 1426 | | Monthly Target 2 | 1620 | | Monthly Target 3 | 1809 | | Monthly Target 4 | 2003 | | Monthly Target 5 | 2192 |
Monthly price and volumes C E
| Date |
Closing |
Open |
Range |
Volume |
Tue 28 October 2025 |
1814.00 (9.99%) |
1641.00 |
1615.00 - 1998.00 |
3.036 times |
Tue 30 September 2025 |
1649.30 (0.37%) |
1650.00 |
1600.10 - 1666.00 |
0.3261 times |
Fri 29 August 2025 |
1643.30 (-8.81%) |
1790.00 |
1627.00 - 1818.40 |
0.3543 times |
Thu 31 July 2025 |
1802.00 (2.4%) |
1759.70 |
1729.00 - 1860.00 |
0.9417 times |
Mon 30 June 2025 |
1759.70 (-9.12%) |
1925.10 |
1715.30 - 1966.90 |
1.6455 times |
Fri 30 May 2025 |
1936.20 (7.87%) |
1788.00 |
1764.00 - 2166.70 |
0.912 times |
Wed 30 April 2025 |
1794.90 (6.25%) |
1680.00 |
1582.00 - 1862.70 |
0.5548 times |
Fri 28 March 2025 |
1689.35 (1.47%) |
1659.90 |
1540.00 - 1705.00 |
0.7665 times |
Fri 28 February 2025 |
1664.80 (-2.15%) |
1709.00 |
1574.10 - 1775.00 |
0.5857 times |
Fri 31 January 2025 |
1701.40 (7.08%) |
1600.00 |
1594.60 - 1733.80 |
0.8773 times |
Tue 31 December 2024 |
1588.95 (-9.33%) |
1700.00 |
1513.00 - 1946.65 |
3.7501 times |
DMA SMA EMA moving averages of C E MAPMYINDIA
DMA (daily moving average) of C E MAPMYINDIA
| DMA period | DMA value | | 5 day DMA | 1820.22 | | 12 day DMA | 1828.78 | | 20 day DMA | 1765.32 | | 35 day DMA | 1711.8 | | 50 day DMA | 1708.32 | | 100 day DMA | 1751.87 | | 150 day DMA | 1780.45 | | 200 day DMA | 1750.09 | EMA (exponential moving average) of C E MAPMYINDIA
| EMA period | EMA current | EMA prev | EMA prev2 | | 5 day EMA | 1818.22 | 1820.33 | 1827.95 | | 12 day EMA | 1805.06 | 1803.43 | 1803.13 | | 20 day EMA | 1779.45 | 1775.81 | 1772.73 | | 35 day EMA | 1754.48 | 1750.98 | 1747.79 | | 50 day EMA | 1725.2 | 1721.58 | 1718.17 |
SMA (simple moving average) of C E MAPMYINDIA
| SMA period | SMA current | SMA prev | SMA prev2 | | 5 day SMA | 1820.22 | 1825.58 | 1833.5 | | 12 day SMA | 1828.78 | 1819.2 | 1809.24 | | 20 day SMA | 1765.32 | 1755.75 | 1746.99 | | 35 day SMA | 1711.8 | 1707.1 | 1702.61 | | 50 day SMA | 1708.32 | 1707.57 | 1707.22 | | 100 day SMA | 1751.87 | 1752.9 | 1753.95 | | 150 day SMA | 1780.45 | 1779.1 | 1777.67 | | 200 day SMA | 1750.09 | 1749.26 | 1748.39 |
|
|
