MangalamOrganics MANORG full analysis,charts,indicators,moving averages,SMA,DMA,EMA,ADX,MACD,RSIMangalam Organics MANORG WideScreen charts, DMA,SMA,EMA technical analysis, forecast prediction, by indicators ADX,MACD,RSI,CCI NSE stock exchange
Daily price and charts and targets MangalamOrganics Strong Daily Stock price targets for MangalamOrganics MANORG are 503.98 and 510.28 | Daily Target 1 | 502.73 | | Daily Target 2 | 505.22 | | Daily Target 3 | 509.03333333333 | | Daily Target 4 | 511.52 | | Daily Target 5 | 515.33 |
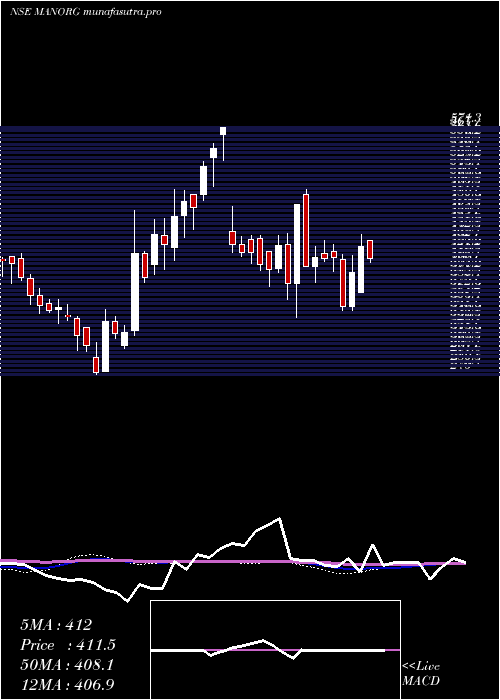
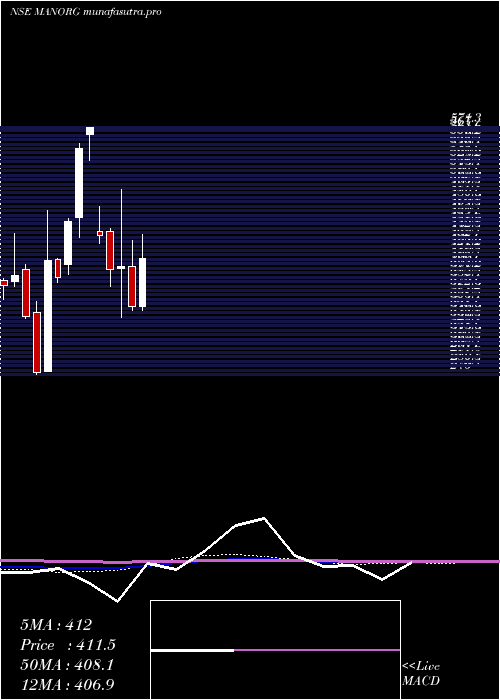
Daily price and volume Mangalam Organics
| Date |
Closing |
Open |
Range |
Volume |
Tue 28 October 2025 |
507.70 (-0.11%) |
512.85 |
506.55 - 512.85 |
0.1018 times |
Mon 27 October 2025 |
508.25 (-1.41%) |
510.50 |
504.95 - 513.70 |
0.6846 times |
Fri 24 October 2025 |
515.50 (0.52%) |
509.55 |
509.55 - 519.70 |
1.3692 times |
Thu 23 October 2025 |
512.85 (-1.07%) |
512.00 |
512.00 - 522.95 |
1.3863 times |
Tue 21 October 2025 |
518.40 (0.48%) |
530.00 |
511.75 - 530.00 |
0.9383 times |
Mon 20 October 2025 |
515.90 (3.73%) |
515.05 |
506.90 - 523.95 |
1.4384 times |
Fri 17 October 2025 |
497.35 (-0.85%) |
506.05 |
492.00 - 509.75 |
0.4815 times |
Thu 16 October 2025 |
501.60 (1.93%) |
509.00 |
496.10 - 511.00 |
0.8377 times |
Wed 15 October 2025 |
492.10 (-3.4%) |
506.20 |
486.85 - 513.80 |
1.7306 times |
Tue 14 October 2025 |
509.40 (0.82%) |
505.55 |
503.00 - 510.00 |
1.0317 times |
Mon 13 October 2025 |
505.25 (-3.52%) |
520.45 |
503.00 - 526.95 |
3.6043 times |

Weekly price and charts MangalamOrganics Strong weekly Stock price targets for MangalamOrganics MANORG are 501.95 and 510.7 | Weekly Target 1 | 500.03 | | Weekly Target 2 | 503.87 | | Weekly Target 3 | 508.78333333333 | | Weekly Target 4 | 512.62 | | Weekly Target 5 | 517.53 |
Weekly price and volumes for Mangalam Organics
| Date |
Closing |
Open |
Range |
Volume |
Tue 28 October 2025 |
507.70 (-1.51%) |
510.50 |
504.95 - 513.70 |
0.0564 times |
Fri 24 October 2025 |
515.50 (3.65%) |
515.05 |
506.90 - 530.00 |
0.3679 times |
Fri 17 October 2025 |
497.35 (-5.03%) |
520.45 |
486.85 - 526.95 |
0.5509 times |
Fri 10 October 2025 |
523.70 (-5.58%) |
557.40 |
507.05 - 557.40 |
0.5623 times |
Fri 03 October 2025 |
554.65 (4.52%) |
517.40 |
504.15 - 560.00 |
0.1497 times |
Fri 26 September 2025 |
530.65 (-3.83%) |
562.85 |
527.40 - 565.00 |
0.4917 times |
Fri 19 September 2025 |
551.80 (-0.42%) |
551.00 |
550.00 - 577.45 |
0.4299 times |
Fri 12 September 2025 |
554.15 (-7.86%) |
579.85 |
553.00 - 594.00 |
0.2717 times |
Tue 20 May 2025 |
601.40 (5.06%) |
575.00 |
558.00 - 601.40 |
2.6962 times |
Fri 16 May 2025 |
572.45 (51.8%) |
407.00 |
407.00 - 572.45 |
4.4233 times |
Fri 09 May 2025 |
377.10 (-4%) |
400.90 |
370.15 - 401.60 |
0.4727 times |
Monthly price and charts MangalamOrganics Strong monthly Stock price targets for MangalamOrganics MANORG are 460.7 and 533.85 | Monthly Target 1 | 445.03 | | Monthly Target 2 | 476.37 | | Monthly Target 3 | 518.18333333333 | | Monthly Target 4 | 549.52 | | Monthly Target 5 | 591.33 |
Monthly price and volumes Mangalam Organics
| Date |
Closing |
Open |
Range |
Volume |
Tue 28 October 2025 |
507.70 (-5.37%) |
534.55 |
486.85 - 560.00 |
0.3604 times |
Tue 30 September 2025 |
536.50 (-10.79%) |
579.85 |
504.15 - 594.00 |
0.2788 times |
Tue 20 May 2025 |
601.40 (51.37%) |
399.05 |
370.15 - 601.40 |
1.6916 times |
Wed 30 April 2025 |
397.30 (12.5%) |
353.10 |
347.75 - 440.15 |
0.485 times |
Fri 28 March 2025 |
353.15 (-12.14%) |
402.15 |
347.90 - 433.15 |
0.8153 times |
Fri 28 February 2025 |
401.95 (1.11%) |
399.70 |
340.10 - 495.00 |
0.9079 times |
Fri 31 January 2025 |
397.55 (-9.57%) |
443.85 |
376.95 - 448.05 |
0.8175 times |
Tue 31 December 2024 |
439.60 (-23.05%) |
445.00 |
429.45 - 474.95 |
0.1634 times |
Tue 03 September 2024 |
571.30 (4.62%) |
562.95 |
531.00 - 571.30 |
0.4289 times |
Fri 30 August 2024 |
546.05 (19.55%) |
461.30 |
436.85 - 551.00 |
4.0513 times |
Wed 31 July 2024 |
456.75 (17.69%) |
404.00 |
392.10 - 460.00 |
1.9384 times |
DMA SMA EMA moving averages of Mangalam Organics MANORG
DMA (daily moving average) of Mangalam Organics MANORG
| DMA period | DMA value | | 5 day DMA | 512.54 | | 12 day DMA | 509 | | 20 day DMA | 519.69 | | 35 day DMA | 537.06 | | 50 day DMA | 508.12 | | 100 day DMA | 456.66 | | 150 day DMA | 454.33 | | 200 day DMA | 430.64 | EMA (exponential moving average) of Mangalam Organics MANORG
| EMA period | EMA current | EMA prev | EMA prev2 | | 5 day EMA | 510.17 | 511.4 | 512.98 | | 12 day EMA | 513.31 | 514.33 | 515.43 | | 20 day EMA | 515.97 | 516.84 | 517.74 | | 35 day EMA | 506.8 | 506.75 | 506.66 | | 50 day EMA | 499.98 | 499.67 | 499.32 |
SMA (simple moving average) of Mangalam Organics MANORG
| SMA period | SMA current | SMA prev | SMA prev2 | | 5 day SMA | 512.54 | 514.18 | 512 | | 12 day SMA | 509 | 510.05 | 511.89 | | 20 day SMA | 519.69 | 520.84 | 522.2 | | 35 day SMA | 537.06 | 538.92 | 540.75 | | 50 day SMA | 508.12 | 505.79 | 503.69 | | 100 day SMA | 456.66 | 455.75 | 454.89 | | 150 day SMA | 454.33 | 454.03 | 453.83 | | 200 day SMA | 430.64 | 429.8 | 429.02 |
|
|
