ManoramaIndustries MANORAMA full analysis,charts,indicators,moving averages,SMA,DMA,EMA,ADX,MACD,RSIManorama Industries MANORAMA WideScreen charts, DMA,SMA,EMA technical analysis, forecast prediction, by indicators ADX,MACD,RSI,CCI NSE stock exchange
Daily price and charts and targets ManoramaIndustries Strong Daily Stock price targets for ManoramaIndustries MANORAMA are 1402 and 1448 | Daily Target 1 | 1367.53 | | Daily Target 2 | 1390.47 | | Daily Target 3 | 1413.5333333333 | | Daily Target 4 | 1436.47 | | Daily Target 5 | 1459.53 |
Daily price and volume Manorama Industries
| Date |
Closing |
Open |
Range |
Volume |
Wed 29 October 2025 |
1413.40 (1.64%) |
1390.60 |
1390.60 - 1436.60 |
0.6454 times |
Tue 28 October 2025 |
1390.60 (-0.76%) |
1401.50 |
1382.00 - 1418.00 |
0.5878 times |
Mon 27 October 2025 |
1401.30 (-2.81%) |
1448.40 |
1395.00 - 1448.40 |
1.0103 times |
Fri 24 October 2025 |
1441.80 (-3.19%) |
1500.00 |
1435.10 - 1500.40 |
0.6596 times |
Thu 23 October 2025 |
1489.30 (-0.52%) |
1529.00 |
1484.50 - 1529.00 |
0.7752 times |
Tue 21 October 2025 |
1497.10 (1.91%) |
1480.00 |
1479.00 - 1508.00 |
0.4389 times |
Mon 20 October 2025 |
1469.00 (-4.06%) |
1540.00 |
1452.30 - 1540.00 |
2.0011 times |
Fri 17 October 2025 |
1531.10 (-0.66%) |
1557.80 |
1475.00 - 1569.90 |
1.6687 times |
Thu 16 October 2025 |
1541.30 (0.26%) |
1541.00 |
1505.00 - 1560.00 |
0.8604 times |
Wed 15 October 2025 |
1537.30 (4.61%) |
1476.10 |
1475.00 - 1553.00 |
1.3526 times |
Tue 14 October 2025 |
1469.60 (-1.67%) |
1510.90 |
1462.30 - 1531.00 |
0.8874 times |
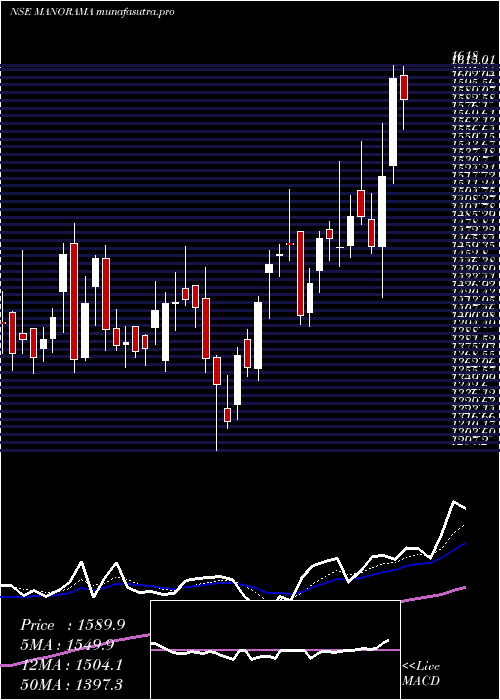
Weekly price and charts ManoramaIndustries Strong weekly Stock price targets for ManoramaIndustries MANORAMA are 1364.5 and 1430.9 | Weekly Target 1 | 1348.2 | | Weekly Target 2 | 1380.8 | | Weekly Target 3 | 1414.6 | | Weekly Target 4 | 1447.2 | | Weekly Target 5 | 1481 |
Weekly price and volumes for Manorama Industries
| Date |
Closing |
Open |
Range |
Volume |
Wed 29 October 2025 |
1413.40 (-1.97%) |
1448.40 |
1382.00 - 1448.40 |
0.6986 times |
Fri 24 October 2025 |
1441.80 (-5.83%) |
1540.00 |
1435.10 - 1540.00 |
1.2065 times |
Fri 17 October 2025 |
1531.10 (2.2%) |
1500.00 |
1462.20 - 1569.90 |
1.7276 times |
Fri 10 October 2025 |
1498.20 (-0.15%) |
1520.00 |
1410.00 - 1525.00 |
0.9099 times |
Fri 03 October 2025 |
1500.40 (6.8%) |
1404.90 |
1370.00 - 1510.00 |
1.3318 times |
Fri 26 September 2025 |
1404.90 (-1.73%) |
1415.70 |
1392.80 - 1489.00 |
0.7761 times |
Fri 19 September 2025 |
1429.70 (5.61%) |
1354.70 |
1344.10 - 1463.80 |
1.1017 times |
Fri 12 September 2025 |
1353.80 (0.91%) |
1355.00 |
1302.90 - 1362.70 |
0.6773 times |
Fri 05 September 2025 |
1341.60 (-1.01%) |
1351.10 |
1312.10 - 1386.00 |
0.9577 times |
Fri 29 August 2025 |
1355.30 (-4.15%) |
1428.60 |
1346.00 - 1429.40 |
0.6127 times |
Fri 22 August 2025 |
1414.00 (2.73%) |
1384.90 |
1369.00 - 1444.90 |
0.9715 times |
Monthly price and charts ManoramaIndustries Strong monthly Stock price targets for ManoramaIndustries MANORAMA are 1391.7 and 1591.6 | Monthly Target 1 | 1251.2 | | Monthly Target 2 | 1332.3 | | Monthly Target 3 | 1451.1 | | Monthly Target 4 | 1532.2 | | Monthly Target 5 | 1651 |
Monthly price and volumes Manorama Industries
| Date |
Closing |
Open |
Range |
Volume |
Wed 29 October 2025 |
1413.40 (1.38%) |
1405.40 |
1370.00 - 1569.90 |
1.0112 times |
Tue 30 September 2025 |
1394.10 (2.86%) |
1351.10 |
1302.90 - 1489.00 |
0.8124 times |
Fri 29 August 2025 |
1355.30 (-10.94%) |
1524.50 |
1345.10 - 1540.00 |
0.7744 times |
Thu 31 July 2025 |
1521.70 (4.18%) |
1469.50 |
1400.60 - 1760.00 |
2.1797 times |
Mon 30 June 2025 |
1460.60 (-0.01%) |
1470.00 |
1297.20 - 1486.70 |
0.9164 times |
Fri 30 May 2025 |
1460.70 (14.59%) |
1274.70 |
1170.00 - 1513.30 |
1.2416 times |
Wed 30 April 2025 |
1274.70 (20.15%) |
1056.00 |
849.95 - 1388.10 |
1.4975 times |
Fri 28 March 2025 |
1060.90 (11.33%) |
914.10 |
740.50 - 1120.00 |
0.6729 times |
Fri 28 February 2025 |
952.95 (-9.43%) |
1068.95 |
910.15 - 1109.00 |
0.443 times |
Fri 31 January 2025 |
1052.15 (-2.19%) |
1085.00 |
958.05 - 1129.00 |
0.4511 times |
Tue 31 December 2024 |
1075.75 (-8.64%) |
1193.75 |
1045.00 - 1256.00 |
0.3366 times |
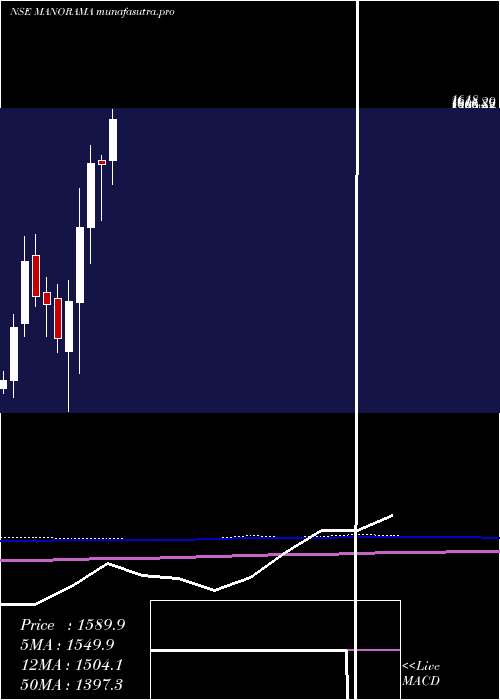
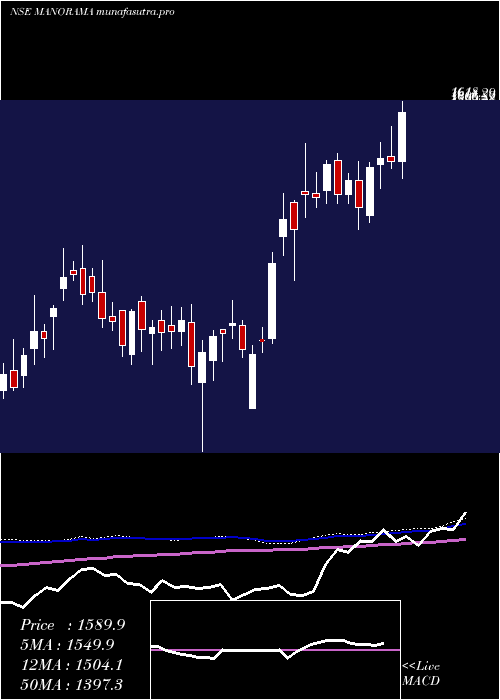
DMA SMA EMA moving averages of Manorama Industries MANORAMA
DMA (daily moving average) of Manorama Industries MANORAMA
| DMA period | DMA value | | 5 day DMA | 1427.28 | | 12 day DMA | 1473.03 | | 20 day DMA | 1463.3 | | 35 day DMA | 1436.76 | | 50 day DMA | 1415.24 | | 100 day DMA | 1438.13 | | 150 day DMA | 1369.22 | | 200 day DMA | 1283.7 | EMA (exponential moving average) of Manorama Industries MANORAMA
| EMA period | EMA current | EMA prev | EMA prev2 | | 5 day EMA | 1425.67 | 1431.81 | 1452.41 | | 12 day EMA | 1449.17 | 1455.67 | 1467.5 | | 20 day EMA | 1450.52 | 1454.43 | 1461.15 | | 35 day EMA | 1435.84 | 1437.16 | 1439.9 | | 50 day EMA | 1412.5 | 1412.46 | 1413.35 |
SMA (simple moving average) of Manorama Industries MANORAMA
| SMA period | SMA current | SMA prev | SMA prev2 | | 5 day SMA | 1427.28 | 1444.02 | 1459.7 | | 12 day SMA | 1473.03 | 1480.09 | 1483.47 | | 20 day SMA | 1463.3 | 1463.71 | 1464.43 | | 35 day SMA | 1436.76 | 1434.02 | 1432.62 | | 50 day SMA | 1415.24 | 1414.5 | 1413.76 | | 100 day SMA | 1438.13 | 1437.97 | 1438.64 | | 150 day SMA | 1369.22 | 1366.67 | 1364.17 | | 200 day SMA | 1283.7 | 1281.73 | 1279.77 |
|
|
