ManomayTex MANOMAY full analysis,charts,indicators,moving averages,SMA,DMA,EMA,ADX,MACD,RSIManomay Tex MANOMAY WideScreen charts, DMA,SMA,EMA technical analysis, forecast prediction, by indicators ADX,MACD,RSI,CCI NSE stock exchange
Daily price and charts and targets ManomayTex Strong Daily Stock price targets for ManomayTex MANOMAY are 210.38 and 212.62 | Daily Target 1 | 208.68 | | Daily Target 2 | 209.83 | | Daily Target 3 | 210.91666666667 | | Daily Target 4 | 212.07 | | Daily Target 5 | 213.16 |
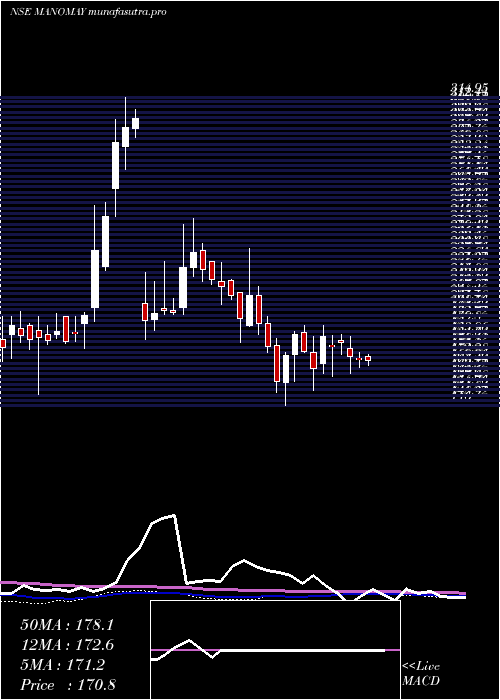
Daily price and volume Manomay Tex
| Date |
Closing |
Open |
Range |
Volume |
Tue 28 October 2025 |
210.99 (0.3%) |
210.36 |
209.76 - 212.00 |
1.1055 times |
Mon 27 October 2025 |
210.36 (2.45%) |
206.87 |
206.01 - 211.08 |
1.7116 times |
Fri 24 October 2025 |
205.33 (0.74%) |
205.75 |
203.11 - 209.00 |
1.0053 times |
Thu 23 October 2025 |
203.83 (-1.13%) |
203.10 |
200.00 - 205.98 |
0.8669 times |
Tue 21 October 2025 |
206.17 (0.26%) |
204.49 |
202.01 - 208.15 |
0.3237 times |
Mon 20 October 2025 |
205.63 (0.48%) |
208.00 |
202.24 - 208.00 |
0.7802 times |
Fri 17 October 2025 |
204.65 (-1.03%) |
206.00 |
195.02 - 208.19 |
1.3013 times |
Thu 16 October 2025 |
206.78 (-0.79%) |
207.89 |
206.13 - 207.89 |
0.7991 times |
Wed 15 October 2025 |
208.43 (-0.55%) |
206.50 |
206.50 - 208.50 |
0.7904 times |
Tue 14 October 2025 |
209.58 (0.35%) |
209.00 |
208.00 - 210.00 |
1.316 times |
Mon 13 October 2025 |
208.85 (3.28%) |
204.50 |
204.50 - 214.00 |
1.7184 times |

Weekly price and charts ManomayTex Strong weekly Stock price targets for ManomayTex MANOMAY are 208.5 and 214.49 | Weekly Target 1 | 203.68 | | Weekly Target 2 | 207.33 | | Weekly Target 3 | 209.66666666667 | | Weekly Target 4 | 213.32 | | Weekly Target 5 | 215.66 |
Weekly price and volumes for Manomay Tex
| Date |
Closing |
Open |
Range |
Volume |
Tue 28 October 2025 |
210.99 (2.76%) |
206.87 |
206.01 - 212.00 |
1.0535 times |
Fri 24 October 2025 |
205.33 (0.33%) |
208.00 |
200.00 - 209.00 |
1.113 times |
Fri 17 October 2025 |
204.65 (1.21%) |
204.50 |
195.02 - 214.00 |
2.2158 times |
Fri 10 October 2025 |
202.21 (11.5%) |
186.86 |
175.97 - 207.09 |
3.0157 times |
Fri 03 October 2025 |
181.35 (7.58%) |
167.74 |
166.90 - 189.90 |
1.2817 times |
Fri 26 September 2025 |
168.58 (-1.96%) |
177.95 |
167.18 - 177.95 |
0.0681 times |
Fri 19 September 2025 |
171.95 (0.02%) |
171.10 |
169.50 - 177.97 |
0.1074 times |
Fri 12 September 2025 |
171.92 (1.42%) |
165.01 |
165.01 - 189.00 |
0.8204 times |
Fri 05 September 2025 |
169.52 (-2.61%) |
178.90 |
161.50 - 178.90 |
0.1375 times |
Fri 29 August 2025 |
174.07 (4.08%) |
164.00 |
161.39 - 179.42 |
0.1869 times |
Fri 22 August 2025 |
167.24 (-0.43%) |
169.67 |
162.25 - 169.67 |
0.2064 times |
Monthly price and charts ManomayTex Strong monthly Stock price targets for ManomayTex MANOMAY are 190.51 and 234.48 | Monthly Target 1 | 154.37 | | Monthly Target 2 | 182.68 | | Monthly Target 3 | 198.34 | | Monthly Target 4 | 226.65 | | Monthly Target 5 | 242.31 |
Monthly price and volumes Manomay Tex
| Date |
Closing |
Open |
Range |
Volume |
Tue 28 October 2025 |
210.99 (24.11%) |
175.00 |
170.03 - 214.00 |
2.6404 times |
Tue 30 September 2025 |
170.00 (-2.34%) |
178.90 |
161.50 - 189.00 |
0.3798 times |
Fri 29 August 2025 |
174.07 (7.68%) |
165.02 |
154.10 - 179.42 |
0.299 times |
Thu 31 July 2025 |
161.65 (-2.76%) |
166.57 |
158.52 - 178.80 |
0.3822 times |
Mon 30 June 2025 |
166.23 (-1.45%) |
167.83 |
164.00 - 180.00 |
0.2752 times |
Fri 30 May 2025 |
168.68 (-0.41%) |
169.18 |
161.00 - 182.99 |
0.3399 times |
Wed 30 April 2025 |
169.37 (1.67%) |
168.99 |
162.01 - 190.00 |
0.4447 times |
Fri 28 March 2025 |
166.58 (4.45%) |
158.51 |
146.00 - 190.00 |
2.1088 times |
Fri 28 February 2025 |
159.49 (-17.67%) |
189.99 |
153.40 - 231.90 |
0.5162 times |
Fri 31 January 2025 |
193.72 (-15.44%) |
229.00 |
180.73 - 234.85 |
2.6138 times |
Tue 31 December 2024 |
229.09 (16.66%) |
199.23 |
195.65 - 248.19 |
4.7025 times |
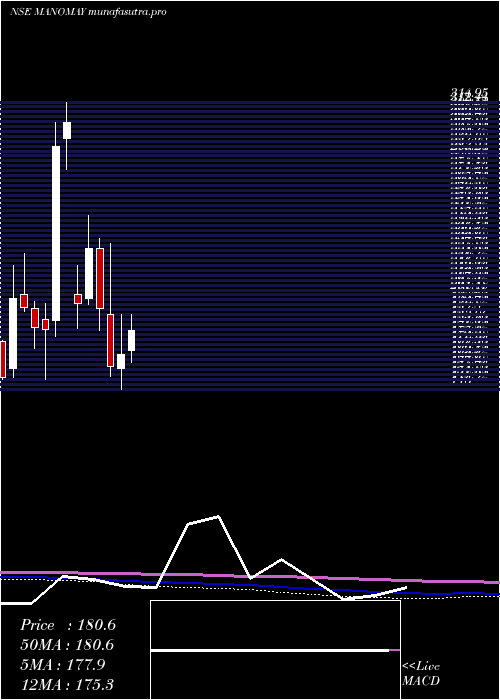
DMA SMA EMA moving averages of Manomay Tex MANOMAY
DMA (daily moving average) of Manomay Tex MANOMAY
| DMA period | DMA value | | 5 day DMA | 207.34 | | 12 day DMA | 206.9 | | 20 day DMA | 197.72 | | 35 day DMA | 186.09 | | 50 day DMA | 180.43 | | 100 day DMA | 173.29 | | 150 day DMA | 172.76 | | 200 day DMA | 177.34 | EMA (exponential moving average) of Manomay Tex MANOMAY
| EMA period | EMA current | EMA prev | EMA prev2 | | 5 day EMA | 208.25 | 206.88 | 205.14 | | 12 day EMA | 204.22 | 202.99 | 201.65 | | 20 day EMA | 198.69 | 197.4 | 196.04 | | 35 day EMA | 190.52 | 189.32 | 188.08 | | 50 day EMA | 181.46 | 180.25 | 179.02 |
SMA (simple moving average) of Manomay Tex MANOMAY
| SMA period | SMA current | SMA prev | SMA prev2 | | 5 day SMA | 207.34 | 206.26 | 205.12 | | 12 day SMA | 206.9 | 206.14 | 205.48 | | 20 day SMA | 197.72 | 195.6 | 193.68 | | 35 day SMA | 186.09 | 184.9 | 183.59 | | 50 day SMA | 180.43 | 179.42 | 178.49 | | 100 day SMA | 173.29 | 172.83 | 172.4 | | 150 day SMA | 172.76 | 172.58 | 172.4 | | 200 day SMA | 177.34 | 177.37 | 177.42 |
|
|
