ManInfraconstruction MANINFRA full analysis,charts,indicators,moving averages,SMA,DMA,EMA,ADX,MACD,RSIMan Infraconstruction MANINFRA WideScreen charts, DMA,SMA,EMA technical analysis, forecast prediction, by indicators ADX,MACD,RSI,CCI NSE stock exchange
operates under Construction & Engineering sector
Daily price and charts and targets ManInfraconstruction Strong Daily Stock price targets for ManInfraconstruction MANINFRA are 145.71 and 148.51 | Daily Target 1 | 143.6 | | Daily Target 2 | 145.01 | | Daily Target 3 | 146.40333333333 | | Daily Target 4 | 147.81 | | Daily Target 5 | 149.2 |
Daily price and volume Man Infraconstruction
| Date |
Closing |
Open |
Range |
Volume |
Wed 29 October 2025 |
146.41 (0.69%) |
145.70 |
145.00 - 147.80 |
1.2044 times |
Tue 28 October 2025 |
145.40 (-0.15%) |
144.76 |
144.51 - 149.30 |
1.9334 times |
Mon 27 October 2025 |
145.62 (0.38%) |
145.07 |
144.50 - 146.60 |
0.5636 times |
Fri 24 October 2025 |
145.07 (-1.5%) |
147.29 |
144.55 - 147.69 |
0.6344 times |
Thu 23 October 2025 |
147.28 (1.37%) |
145.72 |
145.60 - 148.90 |
0.8556 times |
Tue 21 October 2025 |
145.29 (1.45%) |
143.89 |
143.77 - 146.90 |
0.3029 times |
Mon 20 October 2025 |
143.22 (-0.9%) |
145.75 |
141.68 - 146.00 |
1.6442 times |
Fri 17 October 2025 |
144.52 (-1.17%) |
146.00 |
143.57 - 146.19 |
1.0126 times |
Thu 16 October 2025 |
146.23 (0.97%) |
145.49 |
145.49 - 147.30 |
0.4434 times |
Wed 15 October 2025 |
144.82 (-0.54%) |
145.60 |
144.11 - 148.50 |
1.4054 times |
Tue 14 October 2025 |
145.60 (-1.1%) |
146.50 |
145.15 - 148.73 |
0.6768 times |
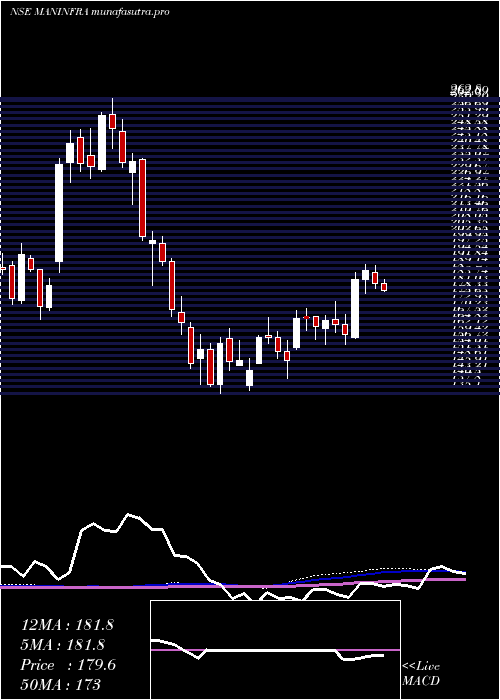
Weekly price and charts ManInfraconstruction Strong weekly Stock price targets for ManInfraconstruction MANINFRA are 145.46 and 150.26 | Weekly Target 1 | 141.94 | | Weekly Target 2 | 144.17 | | Weekly Target 3 | 146.73666666667 | | Weekly Target 4 | 148.97 | | Weekly Target 5 | 151.54 |
Weekly price and volumes for Man Infraconstruction
| Date |
Closing |
Open |
Range |
Volume |
Wed 29 October 2025 |
146.41 (0.92%) |
145.07 |
144.50 - 149.30 |
0.6897 times |
Fri 24 October 2025 |
145.07 (0.38%) |
145.75 |
141.68 - 148.90 |
0.6404 times |
Fri 17 October 2025 |
144.52 (-2.64%) |
148.35 |
143.57 - 148.73 |
0.7602 times |
Fri 10 October 2025 |
148.44 (-1.05%) |
149.88 |
144.00 - 150.02 |
0.6732 times |
Fri 03 October 2025 |
150.02 (0.64%) |
149.00 |
143.80 - 150.86 |
0.8725 times |
Fri 26 September 2025 |
149.06 (-6.04%) |
159.50 |
146.53 - 159.50 |
1.2626 times |
Fri 19 September 2025 |
158.64 (3.44%) |
154.00 |
153.64 - 160.39 |
1.8449 times |
Fri 12 September 2025 |
153.36 (-4.38%) |
160.19 |
152.85 - 162.75 |
1.6302 times |
Fri 05 September 2025 |
160.39 (1.78%) |
157.90 |
157.60 - 163.90 |
0.7845 times |
Fri 29 August 2025 |
157.59 (-4.87%) |
167.00 |
157.17 - 167.00 |
0.8417 times |
Fri 22 August 2025 |
165.65 (6.1%) |
158.45 |
155.51 - 169.60 |
4.0354 times |
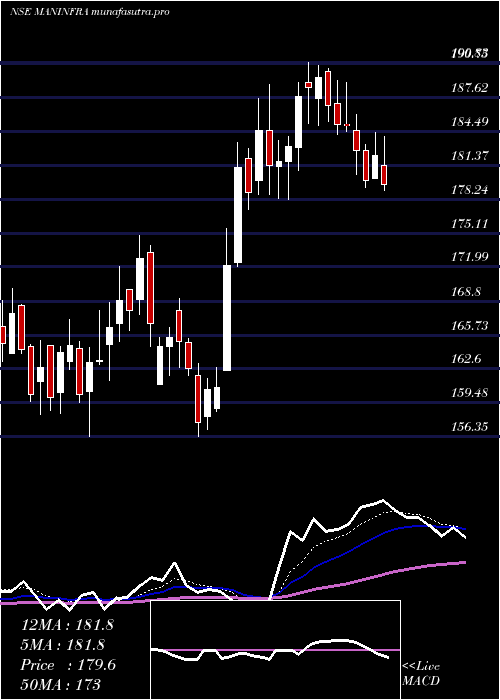
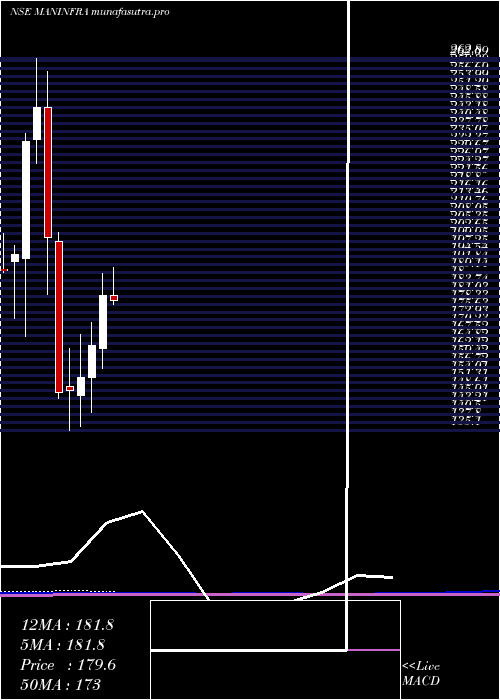
Monthly price and charts ManInfraconstruction Strong monthly Stock price targets for ManInfraconstruction MANINFRA are 139.46 and 148.64 | Monthly Target 1 | 137.14 | | Monthly Target 2 | 141.77 | | Monthly Target 3 | 146.31666666667 | | Monthly Target 4 | 150.95 | | Monthly Target 5 | 155.5 |
Monthly price and volumes Man Infraconstruction
| Date |
Closing |
Open |
Range |
Volume |
Wed 29 October 2025 |
146.41 (-0.03%) |
146.87 |
141.68 - 150.86 |
0.2657 times |
Tue 30 September 2025 |
146.46 (-7.06%) |
157.90 |
145.20 - 163.90 |
0.4682 times |
Fri 29 August 2025 |
157.59 (-9.63%) |
174.50 |
153.35 - 175.60 |
0.5478 times |
Thu 31 July 2025 |
174.38 (-3.82%) |
181.25 |
173.31 - 190.83 |
0.9043 times |
Mon 30 June 2025 |
181.30 (10.49%) |
163.25 |
156.35 - 188.80 |
1.7181 times |
Fri 30 May 2025 |
164.09 (7.07%) |
153.25 |
141.25 - 172.00 |
0.8928 times |
Wed 30 April 2025 |
153.25 (3.04%) |
147.00 |
136.25 - 168.00 |
1.0859 times |
Fri 28 March 2025 |
148.73 (0.53%) |
149.94 |
135.10 - 163.17 |
1.3233 times |
Fri 28 February 2025 |
147.95 (-26.48%) |
200.00 |
145.99 - 203.00 |
0.7878 times |
Fri 31 January 2025 |
201.25 (-18.17%) |
245.95 |
181.77 - 258.22 |
2.0061 times |
Tue 31 December 2024 |
245.95 (5.02%) |
234.95 |
226.50 - 262.80 |
3.1011 times |
DMA SMA EMA moving averages of Man Infraconstruction MANINFRA
DMA (daily moving average) of Man Infraconstruction MANINFRA
| DMA period | DMA value | | 5 day DMA | 145.96 | | 12 day DMA | 145.56 | | 20 day DMA | 146.17 | | 35 day DMA | 149.69 | | 50 day DMA | 153.16 | | 100 day DMA | 163.9 | | 150 day DMA | 161.84 | | 200 day DMA | 167.25 | EMA (exponential moving average) of Man Infraconstruction MANINFRA
| EMA period | EMA current | EMA prev | EMA prev2 | | 5 day EMA | 145.8 | 145.49 | 145.54 | | 12 day EMA | 146.02 | 145.95 | 146.05 | | 20 day EMA | 147.12 | 147.19 | 147.38 | | 35 day EMA | 149.97 | 150.18 | 150.46 | | 50 day EMA | 153.22 | 153.5 | 153.83 |
SMA (simple moving average) of Man Infraconstruction MANINFRA
| SMA period | SMA current | SMA prev | SMA prev2 | | 5 day SMA | 145.96 | 145.73 | 145.3 | | 12 day SMA | 145.56 | 145.73 | 145.66 | | 20 day SMA | 146.17 | 146.18 | 146.36 | | 35 day SMA | 149.69 | 149.89 | 150.32 | | 50 day SMA | 153.16 | 153.36 | 153.7 | | 100 day SMA | 163.9 | 164.07 | 164.25 | | 150 day SMA | 161.84 | 161.86 | 161.9 | | 200 day SMA | 167.25 | 167.73 | 168.2 |
|
|
