ManIndustries MANINDS full analysis,charts,indicators,moving averages,SMA,DMA,EMA,ADX,MACD,RSIMan Industries MANINDS WideScreen charts, DMA,SMA,EMA technical analysis, forecast prediction, by indicators ADX,MACD,RSI,CCI NSE stock exchange
operates under Construction & Engineering sector
Daily price and charts and targets ManIndustries Strong Daily Stock price targets for ManIndustries MANINDS are 405.7 and 413.5 | Daily Target 1 | 399.77 | | Daily Target 2 | 403.83 | | Daily Target 3 | 407.56666666667 | | Daily Target 4 | 411.63 | | Daily Target 5 | 415.37 |
Daily price and volume Man Industries
| Date |
Closing |
Open |
Range |
Volume |
Tue 28 October 2025 |
407.90 (1.24%) |
404.50 |
403.50 - 411.30 |
0.379 times |
Mon 27 October 2025 |
402.90 (-0.53%) |
405.50 |
399.05 - 411.40 |
0.2744 times |
Fri 24 October 2025 |
405.05 (-0.64%) |
404.60 |
403.05 - 409.60 |
0.1999 times |
Thu 23 October 2025 |
407.65 (0.05%) |
412.00 |
401.90 - 413.00 |
0.47 times |
Tue 21 October 2025 |
407.45 (0.68%) |
407.75 |
404.70 - 414.40 |
0.2878 times |
Mon 20 October 2025 |
404.70 (1.72%) |
400.50 |
394.10 - 407.00 |
0.6027 times |
Fri 17 October 2025 |
397.85 (-2.12%) |
402.60 |
394.20 - 404.80 |
0.5984 times |
Thu 16 October 2025 |
406.45 (0.54%) |
403.90 |
398.15 - 413.00 |
1.0033 times |
Wed 15 October 2025 |
404.25 (10.94%) |
366.95 |
360.00 - 408.45 |
5.6917 times |
Tue 14 October 2025 |
364.40 (-2.87%) |
376.00 |
363.15 - 379.00 |
0.4928 times |
Mon 13 October 2025 |
375.15 (-1.83%) |
378.95 |
371.15 - 379.80 |
0.323 times |
Weekly price and charts ManIndustries Strong weekly Stock price targets for ManIndustries MANINDS are 403.48 and 415.83 | Weekly Target 1 | 393.77 | | Weekly Target 2 | 400.83 | | Weekly Target 3 | 406.11666666667 | | Weekly Target 4 | 413.18 | | Weekly Target 5 | 418.47 |
Weekly price and volumes for Man Industries
| Date |
Closing |
Open |
Range |
Volume |
Tue 28 October 2025 |
407.90 (0.7%) |
405.50 |
399.05 - 411.40 |
0.117 times |
Fri 24 October 2025 |
405.05 (1.81%) |
400.50 |
394.10 - 414.40 |
0.2793 times |
Fri 17 October 2025 |
397.85 (4.11%) |
378.95 |
360.00 - 413.00 |
1.4516 times |
Fri 10 October 2025 |
382.15 (1.81%) |
374.95 |
367.80 - 393.00 |
0.8695 times |
Fri 03 October 2025 |
375.35 (-9.23%) |
415.05 |
340.00 - 422.25 |
3.8902 times |
Fri 26 September 2025 |
413.50 (-6.68%) |
438.00 |
410.00 - 458.40 |
0.5507 times |
Fri 19 September 2025 |
443.10 (8.15%) |
410.50 |
408.50 - 449.45 |
0.6316 times |
Fri 12 September 2025 |
409.70 (-3.24%) |
424.00 |
404.50 - 434.00 |
0.3287 times |
Fri 05 September 2025 |
423.40 (10.69%) |
384.65 |
382.95 - 430.95 |
1.6468 times |
Fri 29 August 2025 |
382.50 (-5.38%) |
405.05 |
379.80 - 406.75 |
0.2346 times |
Fri 22 August 2025 |
404.25 (1.98%) |
399.30 |
389.45 - 428.80 |
0.52 times |
Monthly price and charts ManIndustries Strong monthly Stock price targets for ManIndustries MANINDS are 382.2 and 440.1 | Monthly Target 1 | 335.03 | | Monthly Target 2 | 371.47 | | Monthly Target 3 | 392.93333333333 | | Monthly Target 4 | 429.37 | | Monthly Target 5 | 450.83 |
Monthly price and volumes Man Industries
| Date |
Closing |
Open |
Range |
Volume |
Tue 28 October 2025 |
407.90 (12.06%) |
365.80 |
356.50 - 414.40 |
0.9942 times |
Tue 30 September 2025 |
364.00 (-4.84%) |
384.65 |
340.00 - 458.40 |
1.7611 times |
Fri 29 August 2025 |
382.50 (-14.53%) |
447.00 |
379.80 - 458.90 |
0.604 times |
Thu 31 July 2025 |
447.50 (8.48%) |
417.10 |
405.55 - 468.00 |
0.8593 times |
Mon 30 June 2025 |
412.50 (9.69%) |
379.35 |
360.15 - 425.00 |
1.4275 times |
Fri 30 May 2025 |
376.05 (37.62%) |
275.95 |
258.05 - 379.90 |
1.6597 times |
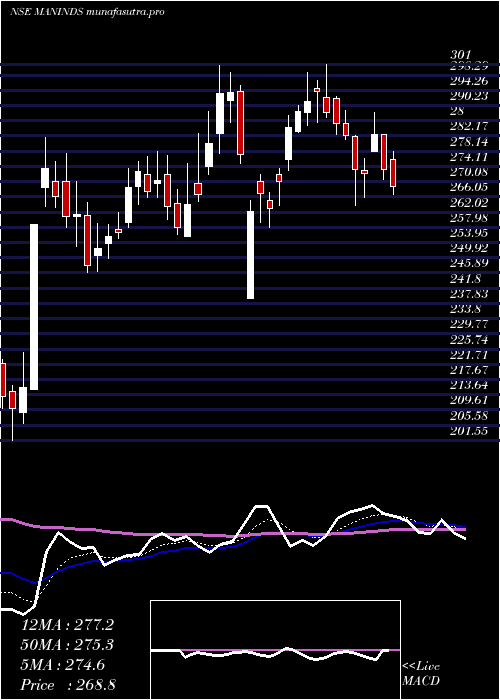
Wed 30 April 2025 |
273.25 (2.49%) |
274.00 |
239.05 - 301.00 |
0.6435 times |
Fri 28 March 2025 |
266.61 (25.02%) |
214.36 |
201.55 - 282.90 |
1.199 times |
Fri 28 February 2025 |
213.25 (-26.69%) |
285.25 |
210.00 - 292.45 |
0.3816 times |
Fri 31 January 2025 |
290.90 (-11.2%) |
329.80 |
257.10 - 355.00 |
0.4701 times |
Tue 31 December 2024 |
327.60 (5.07%) |
311.00 |
309.00 - 379.45 |
0.5361 times |
DMA SMA EMA moving averages of Man Industries MANINDS
DMA (daily moving average) of Man Industries MANINDS
| DMA period | DMA value | | 5 day DMA | 406.19 | | 12 day DMA | 397.16 | | 20 day DMA | 389.2 | | 35 day DMA | 404.12 | | 50 day DMA | 402.73 | | 100 day DMA | 408.91 | | 150 day DMA | 373.24 | | 200 day DMA | 348.74 | EMA (exponential moving average) of Man Industries MANINDS
| EMA period | EMA current | EMA prev | EMA prev2 | | 5 day EMA | 404.89 | 403.39 | 403.63 | | 12 day EMA | 400.24 | 398.85 | 398.11 | | 20 day EMA | 399.24 | 398.33 | 397.85 | | 35 day EMA | 399.2 | 398.69 | 398.44 | | 50 day EMA | 404.22 | 404.07 | 404.12 |
SMA (simple moving average) of Man Industries MANINDS
| SMA period | SMA current | SMA prev | SMA prev2 | | 5 day SMA | 406.19 | 405.55 | 404.54 | | 12 day SMA | 397.16 | 393.93 | 391.37 | | 20 day SMA | 389.2 | 389.48 | 390.56 | | 35 day SMA | 404.12 | 404.56 | 404.9 | | 50 day SMA | 402.73 | 402.58 | 402.45 | | 100 day SMA | 408.91 | 408.78 | 408.66 | | 150 day SMA | 373.24 | 372.31 | 371.33 | | 200 day SMA | 348.74 | 348.31 | 347.95 |
|
|
