MangalamCement MANGLMCEM full analysis,charts,indicators,moving averages,SMA,DMA,EMA,ADX,MACD,RSIMangalam Cement MANGLMCEM WideScreen charts, DMA,SMA,EMA technical analysis, forecast prediction, by indicators ADX,MACD,RSI,CCI NSE stock exchange
operates under Cement & Cement Products sector
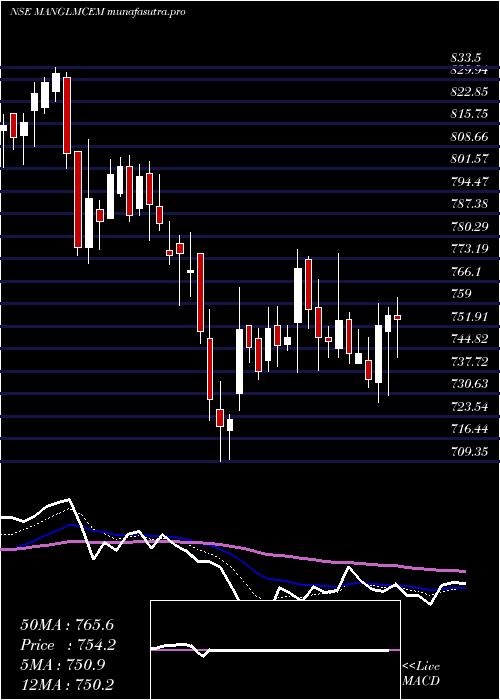
Daily price and charts and targets MangalamCement Strong Daily Stock price targets for MangalamCement MANGLMCEM are 775.15 and 784.1 | Daily Target 1 | 768.8 | | Daily Target 2 | 772.55 | | Daily Target 3 | 777.75 | | Daily Target 4 | 781.5 | | Daily Target 5 | 786.7 |
Daily price and volume Mangalam Cement
| Date |
Closing |
Open |
Range |
Volume |
Wed 29 October 2025 |
776.30 (-0.65%) |
775.05 |
774.00 - 782.95 |
0.6265 times |
Tue 28 October 2025 |
781.35 (-0.16%) |
785.00 |
773.50 - 785.00 |
0.4385 times |
Mon 27 October 2025 |
782.60 (-0.75%) |
781.95 |
775.05 - 794.00 |
0.3934 times |
Fri 24 October 2025 |
788.50 (-0.64%) |
790.00 |
780.95 - 807.40 |
0.6187 times |
Thu 23 October 2025 |
793.55 (3.85%) |
780.00 |
773.00 - 822.95 |
4.2143 times |
Tue 21 October 2025 |
764.10 (1.59%) |
759.90 |
750.10 - 770.00 |
0.627 times |
Mon 20 October 2025 |
752.15 (0.64%) |
747.40 |
743.10 - 762.70 |
0.7252 times |
Fri 17 October 2025 |
747.40 (-1.05%) |
755.35 |
742.95 - 763.30 |
0.7103 times |
Thu 16 October 2025 |
755.35 (0.86%) |
764.95 |
753.00 - 764.95 |
0.5833 times |
Wed 15 October 2025 |
748.90 (2.22%) |
735.30 |
727.00 - 760.00 |
1.0628 times |
Tue 14 October 2025 |
732.65 (-0.27%) |
730.50 |
728.00 - 737.55 |
0.3171 times |
Weekly price and charts MangalamCement Strong weekly Stock price targets for MangalamCement MANGLMCEM are 764.65 and 785.15 | Weekly Target 1 | 760.77 | | Weekly Target 2 | 768.53 | | Weekly Target 3 | 781.26666666667 | | Weekly Target 4 | 789.03 | | Weekly Target 5 | 801.77 |
Weekly price and volumes for Mangalam Cement
| Date |
Closing |
Open |
Range |
Volume |
Wed 29 October 2025 |
776.30 (-1.55%) |
781.95 |
773.50 - 794.00 |
0.391 times |
Fri 24 October 2025 |
788.50 (5.5%) |
747.40 |
743.10 - 822.95 |
1.6583 times |
Fri 17 October 2025 |
747.40 (1.56%) |
730.50 |
727.00 - 764.95 |
0.8774 times |
Fri 10 October 2025 |
735.95 (-2.43%) |
750.15 |
730.00 - 769.00 |
0.6113 times |
Fri 03 October 2025 |
754.25 (1.92%) |
759.95 |
740.00 - 772.00 |
1.0782 times |
Fri 26 September 2025 |
740.05 (-1.71%) |
752.95 |
725.75 - 757.75 |
0.7221 times |
Fri 19 September 2025 |
752.95 (3.94%) |
730.00 |
725.05 - 763.90 |
0.748 times |
Fri 12 September 2025 |
724.40 (-5.69%) |
760.00 |
720.00 - 768.95 |
0.7173 times |
Fri 05 September 2025 |
768.10 (9%) |
700.40 |
700.40 - 799.40 |
2.4722 times |
Fri 29 August 2025 |
704.70 (-3.62%) |
739.45 |
687.10 - 739.45 |
0.7242 times |
Fri 22 August 2025 |
731.20 (2.11%) |
735.00 |
724.05 - 756.00 |
0.8979 times |
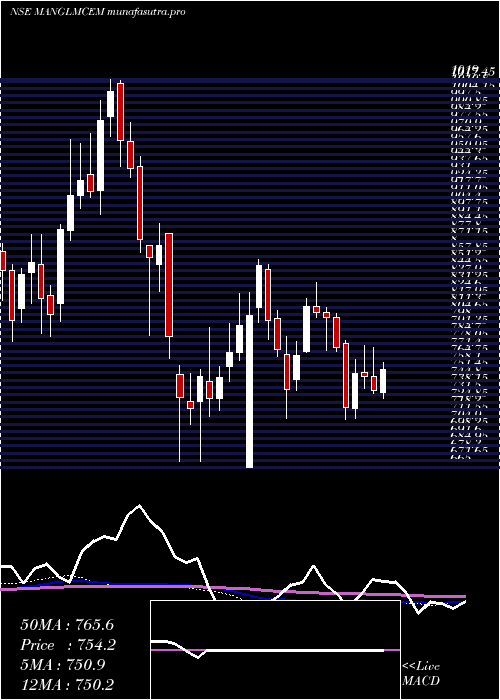
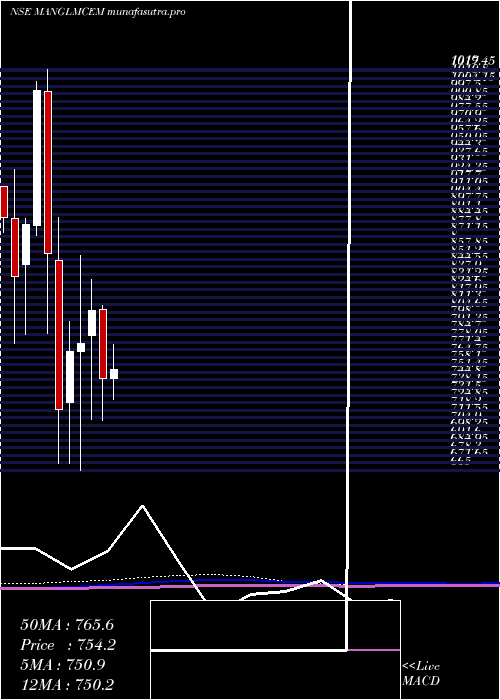
Monthly price and charts MangalamCement Strong monthly Stock price targets for MangalamCement MANGLMCEM are 751.65 and 847.6 | Monthly Target 1 | 679.47 | | Monthly Target 2 | 727.88 | | Monthly Target 3 | 775.41666666667 | | Monthly Target 4 | 823.83 | | Monthly Target 5 | 871.37 |
Monthly price and volumes Mangalam Cement
| Date |
Closing |
Open |
Range |
Volume |
Wed 29 October 2025 |
776.30 (3.98%) |
745.00 |
727.00 - 822.95 |
0.6825 times |
Tue 30 September 2025 |
746.60 (5.95%) |
700.40 |
700.40 - 799.40 |
1.0061 times |
Fri 29 August 2025 |
704.70 (-0.74%) |
708.00 |
681.85 - 777.70 |
1.1439 times |
Thu 31 July 2025 |
709.95 (-4.81%) |
746.00 |
699.00 - 776.20 |
0.512 times |
Mon 30 June 2025 |
745.80 (-7.53%) |
806.90 |
709.35 - 810.95 |
0.7342 times |
Fri 30 May 2025 |
806.55 (3.8%) |
783.85 |
710.00 - 833.50 |
1.2191 times |
Wed 30 April 2025 |
777.00 (0.93%) |
770.00 |
665.00 - 854.55 |
0.733 times |
Fri 28 March 2025 |
769.85 (7.04%) |
725.40 |
671.10 - 796.70 |
1.279 times |
Fri 28 February 2025 |
719.25 (-16.05%) |
850.00 |
671.10 - 888.00 |
1.5851 times |
Fri 31 January 2025 |
856.80 (-14.3%) |
999.00 |
785.95 - 1019.00 |
1.1051 times |
Tue 31 December 2024 |
999.75 (13.31%) |
881.10 |
872.00 - 1008.00 |
1.5104 times |
DMA SMA EMA moving averages of Mangalam Cement MANGLMCEM
DMA (daily moving average) of Mangalam Cement MANGLMCEM
| DMA period | DMA value | | 5 day DMA | 784.46 | | 12 day DMA | 763.12 | | 20 day DMA | 756.08 | | 35 day DMA | 748.52 | | 50 day DMA | 745.44 | | 100 day DMA | 743.53 | | 150 day DMA | 759.43 | | 200 day DMA | 772.48 | EMA (exponential moving average) of Mangalam Cement MANGLMCEM
| EMA period | EMA current | EMA prev | EMA prev2 | | 5 day EMA | 777.7 | 778.4 | 776.93 | | 12 day EMA | 768.09 | 766.6 | 763.92 | | 20 day EMA | 760.78 | 759.15 | 756.81 | | 35 day EMA | 752.77 | 751.38 | 749.62 | | 50 day EMA | 747.29 | 746.11 | 744.67 |
SMA (simple moving average) of Mangalam Cement MANGLMCEM
| SMA period | SMA current | SMA prev | SMA prev2 | | 5 day SMA | 784.46 | 782.02 | 776.18 | | 12 day SMA | 763.12 | 759.76 | 756.46 | | 20 day SMA | 756.08 | 754.64 | 752.57 | | 35 day SMA | 748.52 | 747.41 | 747.03 | | 50 day SMA | 745.44 | 744.24 | 742.93 | | 100 day SMA | 743.53 | 743.76 | 743.8 | | 150 day SMA | 759.43 | 759.18 | 758.89 | | 200 day SMA | 772.48 | 773.46 | 774.36 |
|
|
