MangaloreChemicals MANGCHEFER full analysis,charts,indicators,moving averages,SMA,DMA,EMA,ADX,MACD,RSIMangalore Chemicals MANGCHEFER WideScreen charts, DMA,SMA,EMA technical analysis, forecast prediction, by indicators ADX,MACD,RSI,CCI NSE stock exchange
operates under Fertilizers sector
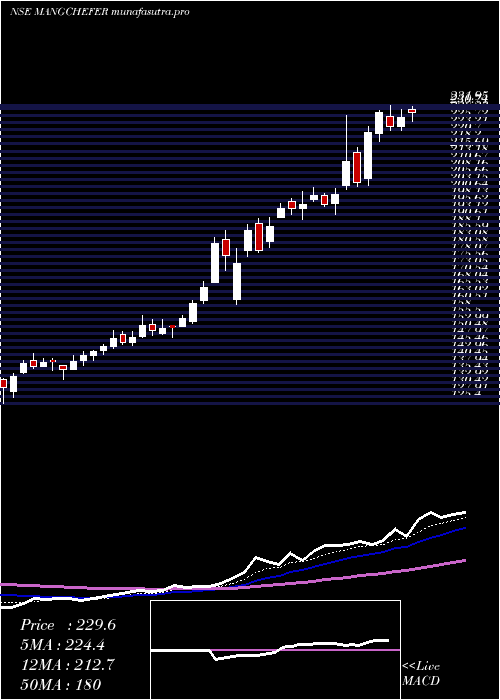
Daily price and charts and targets MangaloreChemicals Strong Daily Stock price targets for MangaloreChemicals MANGCHEFER are 302.33 and 309.93 | Daily Target 1 | 300.22 | | Daily Target 2 | 304.43 | | Daily Target 3 | 307.81666666667 | | Daily Target 4 | 312.03 | | Daily Target 5 | 315.42 |
Daily price and volume Mangalore Chemicals
| Date |
Closing |
Open |
Range |
Volume |
Tue 28 October 2025 |
308.65 (-0.15%) |
309.10 |
303.60 - 311.20 |
1.7092 times |
Mon 27 October 2025 |
309.10 (-0.75%) |
311.40 |
306.75 - 314.20 |
0.8112 times |
Fri 24 October 2025 |
311.45 (-0.89%) |
314.95 |
308.20 - 316.05 |
1.0394 times |
Thu 23 October 2025 |
314.25 (-2.54%) |
324.90 |
311.25 - 324.90 |
1.7825 times |
Tue 21 October 2025 |
322.45 (0.3%) |
323.90 |
318.10 - 324.00 |
0.2088 times |
Mon 20 October 2025 |
321.50 (0.94%) |
319.40 |
315.30 - 322.40 |
0.3898 times |
Fri 17 October 2025 |
318.50 (-0.7%) |
321.00 |
313.80 - 322.10 |
0.663 times |
Thu 16 October 2025 |
320.75 (0.49%) |
318.50 |
316.50 - 323.70 |
1.152 times |
Wed 15 October 2025 |
319.20 (1.85%) |
310.50 |
308.85 - 320.55 |
1.1501 times |
Tue 14 October 2025 |
313.40 (-2.79%) |
318.05 |
309.35 - 322.95 |
1.094 times |
Mon 13 October 2025 |
322.40 (1.29%) |
315.10 |
313.60 - 324.50 |
0.6967 times |
Weekly price and charts MangaloreChemicals Strong weekly Stock price targets for MangaloreChemicals MANGCHEFER are 300.83 and 311.43 | Weekly Target 1 | 298.22 | | Weekly Target 2 | 303.43 | | Weekly Target 3 | 308.81666666667 | | Weekly Target 4 | 314.03 | | Weekly Target 5 | 319.42 |
Weekly price and volumes for Mangalore Chemicals
| Date |
Closing |
Open |
Range |
Volume |
Tue 28 October 2025 |
308.65 (-0.9%) |
311.40 |
303.60 - 314.20 |
0.4641 times |
Fri 24 October 2025 |
311.45 (-2.21%) |
319.40 |
308.20 - 324.90 |
0.6298 times |
Fri 17 October 2025 |
318.50 (0.06%) |
315.10 |
308.85 - 324.50 |
0.8756 times |
Fri 10 October 2025 |
318.30 (-4.04%) |
331.00 |
309.90 - 338.30 |
1.2976 times |
Fri 03 October 2025 |
331.70 (5.34%) |
317.00 |
306.00 - 341.95 |
1.4985 times |
Fri 26 September 2025 |
314.90 (2.64%) |
306.80 |
304.50 - 334.60 |
1.1286 times |
Fri 19 September 2025 |
306.80 (0.21%) |
307.00 |
302.25 - 314.80 |
0.6301 times |
Fri 12 September 2025 |
306.15 (-9.37%) |
335.00 |
301.10 - 338.70 |
1.3188 times |
Fri 05 September 2025 |
337.80 (-2.24%) |
345.00 |
333.45 - 359.90 |
1.2836 times |
Fri 29 August 2025 |
345.55 (-2.52%) |
356.95 |
342.00 - 369.00 |
0.8733 times |
Fri 22 August 2025 |
354.50 (3.26%) |
348.00 |
342.40 - 362.70 |
1.2875 times |

Monthly price and charts MangaloreChemicals Strong monthly Stock price targets for MangaloreChemicals MANGCHEFER are 288.78 and 323.48 | Monthly Target 1 | 282.15 | | Monthly Target 2 | 295.4 | | Monthly Target 3 | 316.85 | | Monthly Target 4 | 330.1 | | Monthly Target 5 | 351.55 |
Monthly price and volumes Mangalore Chemicals
| Date |
Closing |
Open |
Range |
Volume |
Tue 28 October 2025 |
308.65 (-4.86%) |
328.60 |
303.60 - 338.30 |
0.6839 times |
Tue 30 September 2025 |
324.40 (-6.12%) |
345.00 |
301.10 - 359.90 |
1.0236 times |
Fri 29 August 2025 |
345.55 (-2.35%) |
356.75 |
336.90 - 373.15 |
0.8955 times |
Thu 31 July 2025 |
353.85 (29.64%) |
275.00 |
262.80 - 367.95 |
1.4067 times |
Mon 30 June 2025 |
272.95 (3.17%) |
262.00 |
262.00 - 301.75 |
0.9519 times |
Fri 30 May 2025 |
264.56 (17.87%) |
224.46 |
208.83 - 268.95 |
1.5507 times |
Wed 30 April 2025 |
224.46 (44.2%) |
154.65 |
154.10 - 231.95 |
1.5865 times |
Fri 28 March 2025 |
155.66 (18.59%) |
133.90 |
125.40 - 157.00 |
0.3196 times |
Fri 28 February 2025 |
131.26 (-21.67%) |
167.00 |
129.27 - 178.20 |
0.5001 times |
Fri 31 January 2025 |
167.57 (9.14%) |
153.90 |
144.13 - 183.30 |
1.0815 times |
Tue 31 December 2024 |
153.53 (-7.42%) |
166.00 |
152.15 - 170.00 |
0.4958 times |
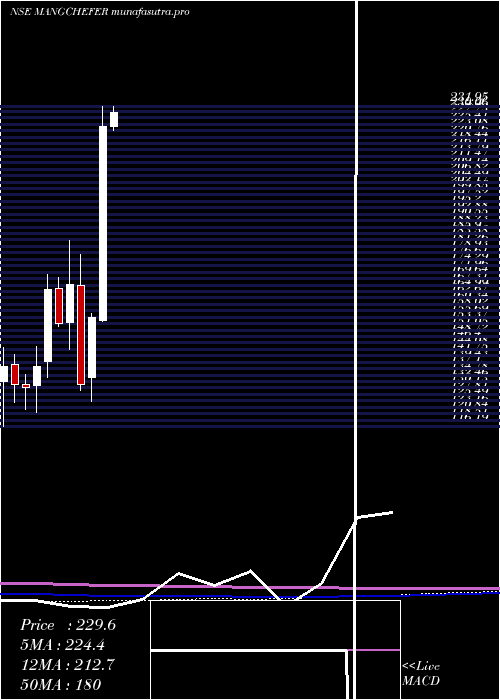
DMA SMA EMA moving averages of Mangalore Chemicals MANGCHEFER
DMA (daily moving average) of Mangalore Chemicals MANGCHEFER
| DMA period | DMA value | | 5 day DMA | 313.18 | | 12 day DMA | 316.66 | | 20 day DMA | 320.93 | | 35 day DMA | 318.84 | | 50 day DMA | 328.61 | | 100 day DMA | 313.72 | | 150 day DMA | 280.61 | | 200 day DMA | 249.41 | EMA (exponential moving average) of Mangalore Chemicals MANGCHEFER
| EMA period | EMA current | EMA prev | EMA prev2 | | 5 day EMA | 312.14 | 313.89 | 316.29 | | 12 day EMA | 316.09 | 317.44 | 318.96 | | 20 day EMA | 318.65 | 319.7 | 320.82 | | 35 day EMA | 324.54 | 325.48 | 326.44 | | 50 day EMA | 328.85 | 329.67 | 330.51 |
SMA (simple moving average) of Mangalore Chemicals MANGCHEFER
| SMA period | SMA current | SMA prev | SMA prev2 | | 5 day SMA | 313.18 | 315.75 | 317.63 | | 12 day SMA | 316.66 | 317.46 | 319.46 | | 20 day SMA | 320.93 | 321.24 | 322.16 | | 35 day SMA | 318.84 | 319.67 | 320.87 | | 50 day SMA | 328.61 | 329.29 | 330 | | 100 day SMA | 313.72 | 313.44 | 313.21 | | 150 day SMA | 280.61 | 279.55 | 278.46 | | 200 day SMA | 249.41 | 248.69 | 248.01 |
|
|
