MangalamDrugs MANGALAM full analysis,charts,indicators,moving averages,SMA,DMA,EMA,ADX,MACD,RSIMangalam Drugs MANGALAM WideScreen charts, DMA,SMA,EMA technical analysis, forecast prediction, by indicators ADX,MACD,RSI,CCI NSE stock exchange
operates under Pharmaceuticals sector
Daily price and charts and targets MangalamDrugs Strong Daily Stock price targets for MangalamDrugs MANGALAM are 63.74 and 67.19 | Daily Target 1 | 62.99 | | Daily Target 2 | 64.48 | | Daily Target 3 | 66.44 | | Daily Target 4 | 67.93 | | Daily Target 5 | 69.89 |
Daily price and volume Mangalam Drugs
| Date |
Closing |
Open |
Range |
Volume |
Thu 30 October 2025 |
65.97 (-0.68%) |
68.40 |
64.95 - 68.40 |
0.7961 times |
Wed 29 October 2025 |
66.42 (3.02%) |
64.47 |
64.08 - 68.90 |
1.8623 times |
Tue 28 October 2025 |
64.47 (-5.14%) |
68.98 |
62.75 - 68.98 |
2.8251 times |
Mon 27 October 2025 |
67.96 (-0.34%) |
68.25 |
67.15 - 70.60 |
1.526 times |
Fri 24 October 2025 |
68.19 (-2.79%) |
70.86 |
67.95 - 70.86 |
0.8252 times |
Thu 23 October 2025 |
70.15 (0.29%) |
71.99 |
67.70 - 71.99 |
0.8698 times |
Tue 21 October 2025 |
69.95 (0.3%) |
69.74 |
66.15 - 73.00 |
0.485 times |
Mon 20 October 2025 |
69.74 (-0.64%) |
70.19 |
68.61 - 70.47 |
0.2559 times |
Fri 17 October 2025 |
70.19 (-0.23%) |
70.28 |
69.80 - 70.96 |
0.2596 times |
Thu 16 October 2025 |
70.35 (1.63%) |
69.11 |
69.01 - 70.85 |
0.2948 times |
Wed 15 October 2025 |
69.22 (-1.24%) |
71.19 |
68.66 - 71.19 |
0.4375 times |

Weekly price and charts MangalamDrugs Strong weekly Stock price targets for MangalamDrugs MANGALAM are 60.44 and 68.29 | Weekly Target 1 | 58.59 | | Weekly Target 2 | 62.28 | | Weekly Target 3 | 66.44 | | Weekly Target 4 | 70.13 | | Weekly Target 5 | 74.29 |
Weekly price and volumes for Mangalam Drugs
| Date |
Closing |
Open |
Range |
Volume |
Thu 30 October 2025 |
65.97 (-3.26%) |
68.25 |
62.75 - 70.60 |
1.565 times |
Fri 24 October 2025 |
68.19 (-2.85%) |
70.19 |
66.15 - 73.00 |
0.5439 times |
Fri 17 October 2025 |
70.19 (0.7%) |
70.04 |
68.21 - 72.10 |
0.7697 times |
Fri 10 October 2025 |
69.70 (-4.09%) |
72.31 |
68.00 - 73.50 |
0.8842 times |
Fri 03 October 2025 |
72.67 (0.62%) |
72.06 |
70.20 - 73.94 |
1.3264 times |
Fri 26 September 2025 |
72.22 (-5.14%) |
76.13 |
71.39 - 77.60 |
0.7931 times |
Fri 19 September 2025 |
76.13 (1.17%) |
75.44 |
74.71 - 77.19 |
0.8284 times |
Fri 12 September 2025 |
75.25 (-4.47%) |
78.77 |
73.35 - 79.49 |
0.7611 times |
Fri 05 September 2025 |
78.77 (6.02%) |
75.39 |
74.15 - 79.70 |
1.0631 times |
Fri 29 August 2025 |
74.30 (-9.17%) |
81.00 |
73.36 - 82.36 |
1.4652 times |
Fri 22 August 2025 |
81.80 (-1.15%) |
83.17 |
79.17 - 84.21 |
1.0686 times |
Monthly price and charts MangalamDrugs Strong monthly Stock price targets for MangalamDrugs MANGALAM are 58.79 and 69.94 | Monthly Target 1 | 56.39 | | Monthly Target 2 | 61.18 | | Monthly Target 3 | 67.54 | | Monthly Target 4 | 72.33 | | Monthly Target 5 | 78.69 |
Monthly price and volumes Mangalam Drugs
| Date |
Closing |
Open |
Range |
Volume |
Thu 30 October 2025 |
65.97 (-7.9%) |
72.30 |
62.75 - 73.90 |
0.767 times |
Tue 30 September 2025 |
71.63 (-3.59%) |
75.39 |
70.50 - 79.70 |
0.5649 times |
Fri 29 August 2025 |
74.30 (-16.18%) |
88.42 |
72.60 - 90.85 |
1.0247 times |
Thu 31 July 2025 |
88.64 (9.83%) |
81.16 |
79.15 - 95.00 |
2.0209 times |
Mon 30 June 2025 |
80.71 (1.53%) |
81.10 |
78.00 - 86.01 |
0.6472 times |
Fri 30 May 2025 |
79.49 (1.88%) |
78.99 |
70.10 - 83.51 |
0.9201 times |
Wed 30 April 2025 |
78.02 (5.01%) |
75.58 |
72.01 - 85.93 |
0.612 times |
Fri 28 March 2025 |
74.30 (-19.17%) |
93.67 |
74.05 - 93.67 |
1.7944 times |
Fri 28 February 2025 |
91.92 (-14.01%) |
103.13 |
91.20 - 116.02 |
0.7963 times |
Fri 31 January 2025 |
106.89 (-7.44%) |
115.48 |
96.30 - 124.89 |
0.8524 times |
Tue 31 December 2024 |
115.48 (-5.45%) |
123.75 |
111.00 - 126.52 |
1.1863 times |
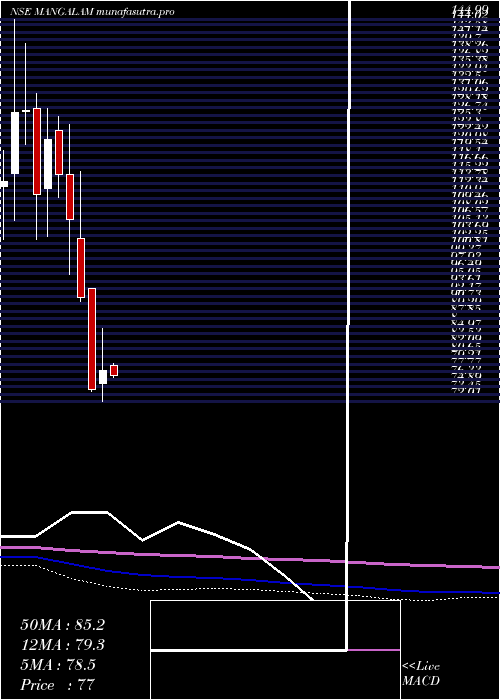
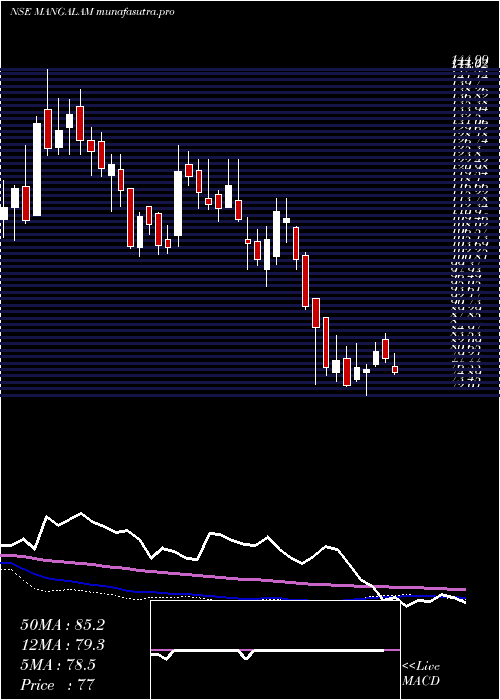
DMA SMA EMA moving averages of Mangalam Drugs MANGALAM
DMA (daily moving average) of Mangalam Drugs MANGALAM
| DMA period | DMA value | | 5 day DMA | 66.6 | | 12 day DMA | 68.56 | | 20 day DMA | 69.35 | | 35 day DMA | 71.65 | | 50 day DMA | 73.58 | | 100 day DMA | 78.88 | | 150 day DMA | 78.87 | | 200 day DMA | 83.82 | EMA (exponential moving average) of Mangalam Drugs MANGALAM
| EMA period | EMA current | EMA prev | EMA prev2 | | 5 day EMA | 66.72 | 67.1 | 67.44 | | 12 day EMA | 68.13 | 68.52 | 68.9 | | 20 day EMA | 69.34 | 69.69 | 70.03 | | 35 day EMA | 71.3 | 71.61 | 71.92 | | 50 day EMA | 73.22 | 73.52 | 73.81 |
SMA (simple moving average) of Mangalam Drugs MANGALAM
| SMA period | SMA current | SMA prev | SMA prev2 | | 5 day SMA | 66.6 | 67.44 | 68.14 | | 12 day SMA | 68.56 | 68.83 | 69.11 | | 20 day SMA | 69.35 | 69.63 | 69.95 | | 35 day SMA | 71.65 | 71.95 | 72.26 | | 50 day SMA | 73.58 | 73.88 | 74.21 | | 100 day SMA | 78.88 | 79.03 | 79.18 | | 150 day SMA | 78.87 | 78.96 | 79.05 | | 200 day SMA | 83.82 | 84.06 | 84.3 |
|
|
