MangalCredit MANCREDIT full analysis,charts,indicators,moving averages,SMA,DMA,EMA,ADX,MACD,RSIMangal Credit MANCREDIT WideScreen charts, DMA,SMA,EMA technical analysis, forecast prediction, by indicators ADX,MACD,RSI,CCI NSE stock exchange
Daily price and charts and targets MangalCredit Strong Daily Stock price targets for MangalCredit MANCREDIT are 183.27 and 187.77 | Daily Target 1 | 179.68 | | Daily Target 2 | 182.35 | | Daily Target 3 | 184.17666666667 | | Daily Target 4 | 186.85 | | Daily Target 5 | 188.68 |
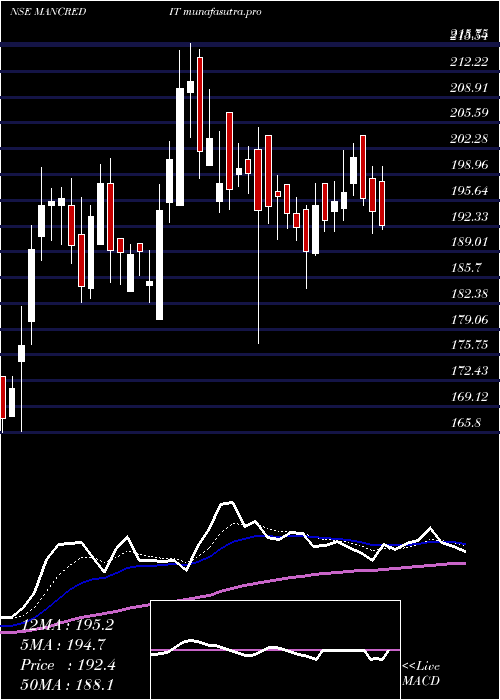
Daily price and volume Mangal Credit
| Date |
Closing |
Open |
Range |
Volume |
Wed 29 October 2025 |
185.03 (1.18%) |
184.12 |
181.50 - 186.00 |
1.116 times |
Tue 28 October 2025 |
182.88 (2.04%) |
177.45 |
177.45 - 188.31 |
1.3548 times |
Mon 27 October 2025 |
179.23 (0.57%) |
180.99 |
178.05 - 181.65 |
0.7705 times |
Fri 24 October 2025 |
178.21 (-1.5%) |
180.91 |
177.28 - 181.05 |
0.812 times |
Thu 23 October 2025 |
180.93 (0.03%) |
178.09 |
177.50 - 182.80 |
1.1755 times |
Tue 21 October 2025 |
180.87 (-0.23%) |
180.96 |
175.99 - 182.01 |
0.4365 times |
Mon 20 October 2025 |
181.29 (0.27%) |
181.35 |
179.35 - 185.00 |
1.1845 times |
Fri 17 October 2025 |
180.80 (0.79%) |
182.49 |
179.00 - 182.50 |
0.8198 times |
Thu 16 October 2025 |
179.39 (-1.85%) |
184.96 |
179.20 - 185.38 |
1.1233 times |
Wed 15 October 2025 |
182.78 (3.78%) |
179.01 |
176.20 - 183.95 |
1.207 times |
Tue 14 October 2025 |
176.13 (-1.77%) |
181.55 |
174.11 - 184.00 |
2.3595 times |
Weekly price and charts MangalCredit Strong weekly Stock price targets for MangalCredit MANCREDIT are 181.24 and 192.1 | Weekly Target 1 | 172.74 | | Weekly Target 2 | 178.88 | | Weekly Target 3 | 183.59666666667 | | Weekly Target 4 | 189.74 | | Weekly Target 5 | 194.46 |
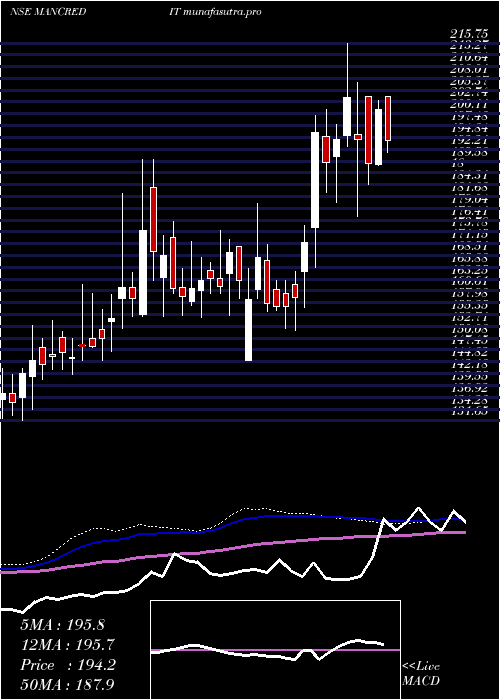
Weekly price and volumes for Mangal Credit
| Date |
Closing |
Open |
Range |
Volume |
Wed 29 October 2025 |
185.03 (3.83%) |
180.99 |
177.45 - 188.31 |
0.5982 times |
Fri 24 October 2025 |
178.21 (-1.43%) |
181.35 |
175.99 - 185.00 |
0.666 times |
Fri 17 October 2025 |
180.80 (0.23%) |
182.91 |
174.11 - 185.38 |
1.1995 times |
Fri 10 October 2025 |
180.38 (-1.31%) |
183.61 |
177.37 - 185.68 |
0.9557 times |
Fri 03 October 2025 |
182.78 (-1.85%) |
187.42 |
180.00 - 187.85 |
0.5233 times |
Fri 26 September 2025 |
186.23 (-0.89%) |
188.18 |
184.00 - 192.90 |
0.7922 times |
Fri 19 September 2025 |
187.91 (0.47%) |
187.95 |
185.00 - 195.00 |
0.7007 times |
Fri 12 September 2025 |
187.04 (1.66%) |
187.50 |
183.82 - 188.05 |
0.7971 times |
Fri 05 September 2025 |
183.99 (1.74%) |
180.10 |
180.00 - 188.80 |
1.3509 times |
Fri 29 August 2025 |
180.85 (-1.19%) |
180.33 |
180.25 - 187.50 |
2.4164 times |
Fri 22 August 2025 |
183.03 (0.12%) |
179.01 |
178.88 - 190.00 |
1.4943 times |
Monthly price and charts MangalCredit Strong monthly Stock price targets for MangalCredit MANCREDIT are 179.57 and 193.77 | Monthly Target 1 | 168.28 | | Monthly Target 2 | 176.66 | | Monthly Target 3 | 182.48333333333 | | Monthly Target 4 | 190.86 | | Monthly Target 5 | 196.68 |
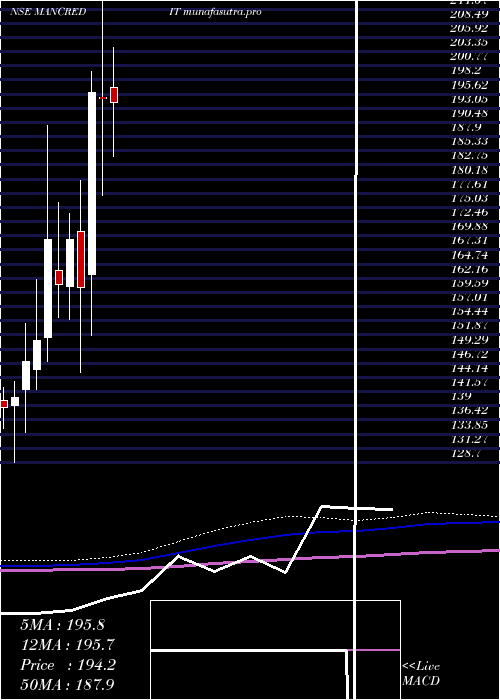
Monthly price and volumes Mangal Credit
| Date |
Closing |
Open |
Range |
Volume |
Wed 29 October 2025 |
185.03 (2.67%) |
185.00 |
174.11 - 188.31 |
0.8615 times |
Tue 30 September 2025 |
180.22 (-0.35%) |
180.10 |
180.00 - 195.00 |
0.9293 times |
Fri 29 August 2025 |
180.85 (-2.17%) |
191.00 |
173.60 - 193.96 |
1.7797 times |
Thu 31 July 2025 |
184.86 (-5.12%) |
196.80 |
183.01 - 204.00 |
1.2145 times |
Mon 30 June 2025 |
194.84 (-0.55%) |
194.99 |
177.20 - 215.75 |
1.6112 times |
Fri 30 May 2025 |
195.92 (22.07%) |
162.90 |
151.71 - 199.80 |
0.7918 times |
Wed 30 April 2025 |
160.50 (-5.13%) |
170.60 |
145.00 - 180.00 |
0.3725 times |
Fri 28 March 2025 |
169.17 (5.04%) |
160.67 |
154.60 - 173.99 |
0.4039 times |
Fri 28 February 2025 |
161.05 (-4.87%) |
163.61 |
155.00 - 176.00 |
0.5311 times |
Fri 31 January 2025 |
169.29 (12.21%) |
151.43 |
147.02 - 190.00 |
1.5046 times |
Tue 31 December 2024 |
150.87 (2.65%) |
145.61 |
141.90 - 161.98 |
0.9206 times |
DMA SMA EMA moving averages of Mangal Credit MANCREDIT
DMA (daily moving average) of Mangal Credit MANCREDIT
| DMA period | DMA value | | 5 day DMA | 181.26 | | 12 day DMA | 180.57 | | 20 day DMA | 181.07 | | 35 day DMA | 183.89 | | 50 day DMA | 183.8 | | 100 day DMA | 187.78 | | 150 day DMA | 180.99 | | 200 day DMA | 176.6 | EMA (exponential moving average) of Mangal Credit MANCREDIT
| EMA period | EMA current | EMA prev | EMA prev2 | | 5 day EMA | 182.18 | 180.76 | 179.7 | | 12 day EMA | 181.49 | 180.85 | 180.48 | | 20 day EMA | 181.84 | 181.5 | 181.35 | | 35 day EMA | 182.23 | 182.07 | 182.02 | | 50 day EMA | 183.19 | 183.12 | 183.13 |
SMA (simple moving average) of Mangal Credit MANCREDIT
| SMA period | SMA current | SMA prev | SMA prev2 | | 5 day SMA | 181.26 | 180.42 | 180.11 | | 12 day SMA | 180.57 | 180.18 | 180.08 | | 20 day SMA | 181.07 | 180.95 | 181.12 | | 35 day SMA | 183.89 | 183.9 | 183.93 | | 50 day SMA | 183.8 | 183.75 | 183.69 | | 100 day SMA | 187.78 | 187.91 | 188.01 | | 150 day SMA | 180.99 | 180.84 | 180.7 | | 200 day SMA | 176.6 | 176.51 | 176.44 |
|
|
