MallcomIndia MALLCOM full analysis,charts,indicators,moving averages,SMA,DMA,EMA,ADX,MACD,RSIMallcom India MALLCOM WideScreen charts, DMA,SMA,EMA technical analysis, forecast prediction, by indicators ADX,MACD,RSI,CCI NSE stock exchange
Daily price and charts and targets MallcomIndia Strong Daily Stock price targets for MallcomIndia MALLCOM are 1421.7 and 1462.1 | Daily Target 1 | 1390.37 | | Daily Target 2 | 1412.63 | | Daily Target 3 | 1430.7666666667 | | Daily Target 4 | 1453.03 | | Daily Target 5 | 1471.17 |
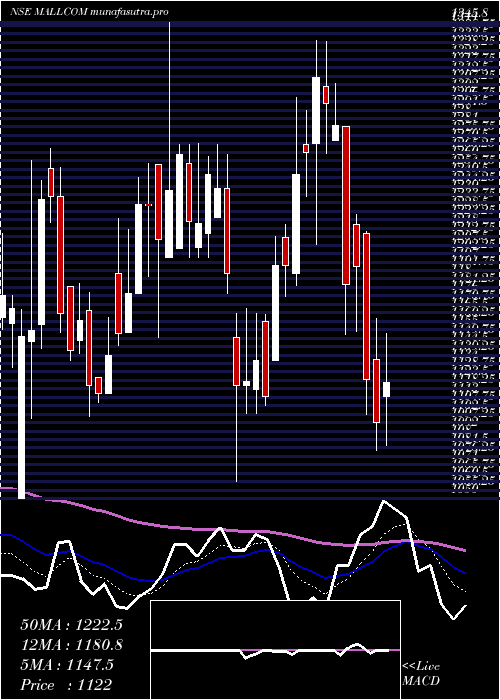
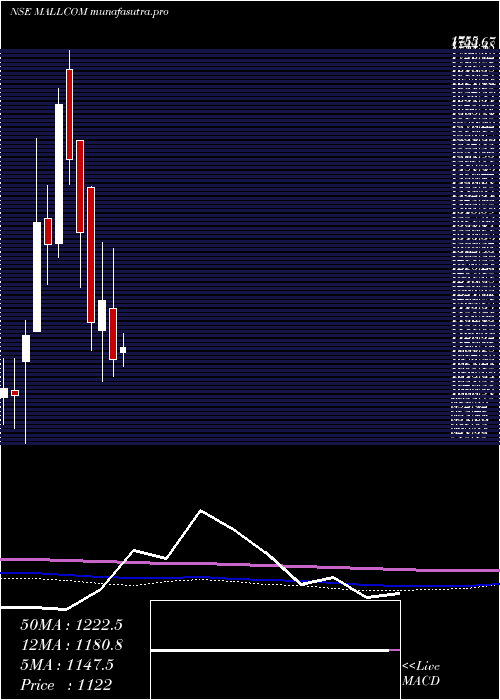
Daily price and volume Mallcom India
| Date |
Closing |
Open |
Range |
Volume |
Tue 28 October 2025 |
1434.90 (1.04%) |
1430.20 |
1408.50 - 1448.90 |
0.6278 times |
Mon 27 October 2025 |
1420.10 (-1.12%) |
1443.20 |
1410.00 - 1460.00 |
0.8306 times |
Fri 24 October 2025 |
1436.20 (-1.58%) |
1450.10 |
1425.20 - 1467.90 |
0.6269 times |
Thu 23 October 2025 |
1459.20 (-1.91%) |
1500.00 |
1455.00 - 1514.90 |
0.8626 times |
Tue 21 October 2025 |
1487.60 (2.86%) |
1446.00 |
1442.90 - 1520.00 |
2.0135 times |
Mon 20 October 2025 |
1446.30 (-0.6%) |
1455.00 |
1437.60 - 1483.10 |
0.8583 times |
Fri 17 October 2025 |
1455.00 (2.89%) |
1414.10 |
1391.00 - 1469.90 |
1.3777 times |
Thu 16 October 2025 |
1414.10 (0.52%) |
1390.00 |
1387.40 - 1435.00 |
0.8811 times |
Wed 15 October 2025 |
1406.80 (0.35%) |
1474.00 |
1391.00 - 1474.00 |
1.172 times |
Tue 14 October 2025 |
1401.90 (-3.49%) |
1436.00 |
1397.00 - 1469.70 |
0.7495 times |
Mon 13 October 2025 |
1452.60 (1.17%) |
1450.00 |
1418.80 - 1474.80 |
1.1256 times |
Weekly price and charts MallcomIndia Strong weekly Stock price targets for MallcomIndia MALLCOM are 1395.95 and 1447.45 | Weekly Target 1 | 1382.97 | | Weekly Target 2 | 1408.93 | | Weekly Target 3 | 1434.4666666667 | | Weekly Target 4 | 1460.43 | | Weekly Target 5 | 1485.97 |
Weekly price and volumes for Mallcom India
| Date |
Closing |
Open |
Range |
Volume |
Tue 28 October 2025 |
1434.90 (-0.09%) |
1443.20 |
1408.50 - 1460.00 |
0.3682 times |
Fri 24 October 2025 |
1436.20 (-1.29%) |
1455.00 |
1425.20 - 1520.00 |
1.1011 times |
Fri 17 October 2025 |
1455.00 (1.34%) |
1450.00 |
1387.40 - 1474.80 |
1.3396 times |
Fri 10 October 2025 |
1435.80 (10.86%) |
1288.40 |
1274.80 - 1517.00 |
2.957 times |
Fri 03 October 2025 |
1295.20 (-0.32%) |
1315.20 |
1227.30 - 1315.20 |
0.4555 times |
Fri 26 September 2025 |
1299.40 (-3.44%) |
1343.80 |
1281.00 - 1421.00 |
1.1246 times |
Fri 19 September 2025 |
1345.70 (5.12%) |
1275.00 |
1268.20 - 1371.90 |
0.9224 times |
Fri 12 September 2025 |
1280.20 (1.29%) |
1260.00 |
1255.00 - 1300.00 |
0.4438 times |
Fri 05 September 2025 |
1263.90 (0.37%) |
1245.20 |
1237.10 - 1312.20 |
0.6464 times |
Fri 29 August 2025 |
1259.20 (4.08%) |
1203.00 |
1171.10 - 1300.00 |
0.6414 times |
Fri 22 August 2025 |
1209.80 (1.2%) |
1244.00 |
1201.10 - 1254.90 |
0.6982 times |

Monthly price and charts MallcomIndia Strong monthly Stock price targets for MallcomIndia MALLCOM are 1344.35 and 1610.55 | Monthly Target 1 | 1136.7 | | Monthly Target 2 | 1285.8 | | Monthly Target 3 | 1402.9 | | Monthly Target 4 | 1552 | | Monthly Target 5 | 1669.1 |
Monthly price and volumes Mallcom India
| Date |
Closing |
Open |
Range |
Volume |
Tue 28 October 2025 |
1434.90 (14.49%) |
1253.80 |
1253.80 - 1520.00 |
1.0848 times |
Tue 30 September 2025 |
1253.30 (-0.47%) |
1245.20 |
1227.30 - 1421.00 |
0.6194 times |
Fri 29 August 2025 |
1259.20 (-3.49%) |
1305.00 |
1165.10 - 1307.00 |
0.6561 times |
Thu 31 July 2025 |
1304.80 (0.79%) |
1295.00 |
1205.10 - 1370.00 |
1.5078 times |
Mon 30 June 2025 |
1294.60 (14.27%) |
1121.60 |
1070.40 - 1355.00 |
3.4528 times |
Fri 30 May 2025 |
1132.90 (3.27%) |
1113.40 |
1052.10 - 1272.50 |
0.7766 times |
Wed 30 April 2025 |
1097.00 (-10.24%) |
1206.15 |
1060.55 - 1335.00 |
0.637 times |
Fri 28 March 2025 |
1222.20 (3.9%) |
1158.70 |
1050.00 - 1345.80 |
0.5631 times |
Fri 28 February 2025 |
1176.35 (-14.04%) |
1464.95 |
1117.60 - 1466.00 |
0.3647 times |
Fri 31 January 2025 |
1368.50 (-10.14%) |
1564.00 |
1250.00 - 1564.00 |
0.3375 times |
Tue 31 December 2024 |
1522.85 (-7.21%) |
1715.25 |
1470.00 - 1755.00 |
0.1009 times |
DMA SMA EMA moving averages of Mallcom India MALLCOM
DMA (daily moving average) of Mallcom India MALLCOM
| DMA period | DMA value | | 5 day DMA | 1447.6 | | 12 day DMA | 1437.54 | | 20 day DMA | 1388.45 | | 35 day DMA | 1359.29 | | 50 day DMA | 1325 | | 100 day DMA | 1285.12 | | 150 day DMA | 1251.17 | | 200 day DMA | 1264.37 | EMA (exponential moving average) of Mallcom India MALLCOM
| EMA period | EMA current | EMA prev | EMA prev2 | | 5 day EMA | 1437.12 | 1438.23 | 1447.29 | | 12 day EMA | 1424.49 | 1422.6 | 1423.05 | | 20 day EMA | 1402.37 | 1398.95 | 1396.72 | | 35 day EMA | 1363.96 | 1359.78 | 1356.23 | | 50 day EMA | 1328.14 | 1323.78 | 1319.85 |
SMA (simple moving average) of Mallcom India MALLCOM
| SMA period | SMA current | SMA prev | SMA prev2 | | 5 day SMA | 1447.6 | 1449.88 | 1456.86 | | 12 day SMA | 1437.54 | 1431.4 | 1425.96 | | 20 day SMA | 1388.45 | 1381.68 | 1379.49 | | 35 day SMA | 1359.29 | 1354.4 | 1350.69 | | 50 day SMA | 1325 | 1321.47 | 1317.14 | | 100 day SMA | 1285.12 | 1281.89 | 1278.95 | | 150 day SMA | 1251.17 | 1249.29 | 1247.41 | | 200 day SMA | 1264.37 | 1264.62 | 1265.1 |
|
|
