MahickraChemical MAHICKRA_SM full analysis,charts,indicators,moving averages,SMA,DMA,EMA,ADX,MACD,RSIMahickra Chemical MAHICKRA_SM WideScreen charts, DMA,SMA,EMA technical analysis, forecast prediction, by indicators ADX,MACD,RSI,CCI NSE stock exchange
Daily price and charts and targets MahickraChemical Strong Daily Stock price targets for MahickraChemical MAHICKRA_SM are 158.3 and 158.3 | Daily Target 1 | 158.3 | | Daily Target 2 | 158.3 | | Daily Target 3 | 158.3 | | Daily Target 4 | 158.3 | | Daily Target 5 | 158.3 |
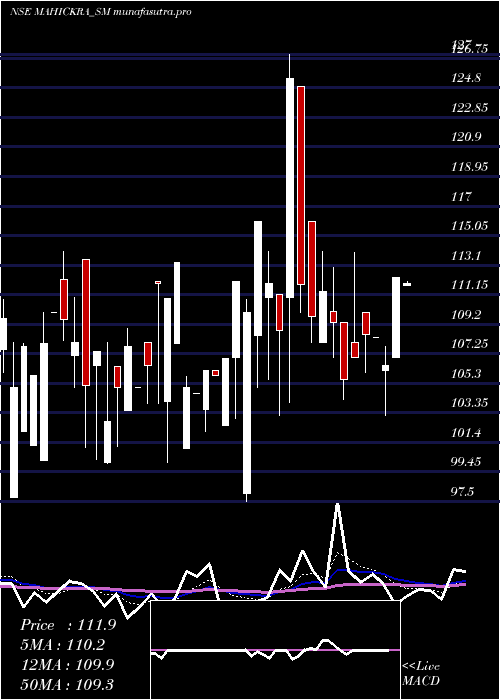
Daily price and volume Mahickra Chemical
| Date |
Closing |
Open |
Range |
Volume |
Tue 28 October 2025 |
158.30 (-1.62%) |
158.30 |
158.30 - 158.30 |
0.1408 times |
Mon 27 October 2025 |
160.90 (0%) |
161.20 |
160.90 - 161.20 |
0.2817 times |
Fri 24 October 2025 |
160.90 (-1.35%) |
160.90 |
160.90 - 160.90 |
0.1408 times |
Thu 23 October 2025 |
163.10 (0.52%) |
163.10 |
163.10 - 163.10 |
0.1408 times |
Tue 21 October 2025 |
162.25 (5.36%) |
151.00 |
151.00 - 179.90 |
3.8028 times |
Mon 20 October 2025 |
154.00 (0.92%) |
152.60 |
152.60 - 154.00 |
0.4225 times |
Fri 17 October 2025 |
152.60 (-0.13%) |
169.00 |
146.00 - 169.00 |
3.8028 times |
Thu 16 October 2025 |
152.80 (-1.93%) |
152.00 |
150.10 - 155.50 |
0.9859 times |
Wed 15 October 2025 |
155.80 (-0.13%) |
155.80 |
155.80 - 155.80 |
0.1408 times |
Tue 14 October 2025 |
156.00 (0%) |
156.00 |
156.00 - 156.00 |
0.1408 times |
Fri 10 October 2025 |
156.00 (-0.57%) |
150.00 |
150.00 - 156.00 |
1.6901 times |
Weekly price and charts MahickraChemical Strong weekly Stock price targets for MahickraChemical MAHICKRA_SM are 156.85 and 159.75 | Weekly Target 1 | 156.37 | | Weekly Target 2 | 157.33 | | Weekly Target 3 | 159.26666666667 | | Weekly Target 4 | 160.23 | | Weekly Target 5 | 162.17 |
Weekly price and volumes for Mahickra Chemical
| Date |
Closing |
Open |
Range |
Volume |
Tue 28 October 2025 |
158.30 (-1.62%) |
161.20 |
158.30 - 161.20 |
0.1027 times |
Fri 24 October 2025 |
160.90 (5.44%) |
152.60 |
151.00 - 179.90 |
1.0959 times |
Fri 17 October 2025 |
152.60 (-2.18%) |
156.00 |
146.00 - 169.00 |
1.2329 times |
Fri 10 October 2025 |
156.00 (0.71%) |
145.00 |
145.00 - 171.00 |
2.226 times |
Wed 01 October 2025 |
154.90 (-1.96%) |
178.95 |
148.00 - 178.95 |
0.2055 times |
Fri 26 September 2025 |
158.00 (-0.63%) |
159.00 |
152.10 - 171.00 |
0.411 times |
Fri 19 September 2025 |
159.00 (5.3%) |
153.95 |
150.00 - 180.00 |
2.774 times |
Fri 12 September 2025 |
151.00 (4.9%) |
147.90 |
140.00 - 155.00 |
0.4452 times |
Fri 05 September 2025 |
143.95 (-11.14%) |
142.50 |
142.50 - 159.00 |
0.8904 times |
Fri 29 August 2025 |
162.00 (10.96%) |
142.00 |
142.00 - 164.90 |
0.6164 times |
Fri 22 August 2025 |
146.00 (2.89%) |
151.00 |
138.55 - 161.00 |
0.7877 times |

Monthly price and charts MahickraChemical Strong monthly Stock price targets for MahickraChemical MAHICKRA_SM are 151.65 and 186.55 | Monthly Target 1 | 126.17 | | Monthly Target 2 | 142.23 | | Monthly Target 3 | 161.06666666667 | | Monthly Target 4 | 177.13 | | Monthly Target 5 | 195.97 |
Monthly price and volumes Mahickra Chemical
| Date |
Closing |
Open |
Range |
Volume |
Tue 28 October 2025 |
158.30 (0.19%) |
148.10 |
145.00 - 179.90 |
0.4146 times |
Mon 29 September 2025 |
158.00 (-2.47%) |
142.50 |
140.00 - 180.00 |
0.4026 times |
Fri 29 August 2025 |
162.00 (15.71%) |
135.00 |
127.30 - 164.90 |
0.2535 times |
Thu 31 July 2025 |
140.00 (11.73%) |
117.50 |
112.00 - 150.00 |
0.8679 times |
Mon 30 June 2025 |
125.30 (0.97%) |
140.00 |
115.95 - 140.00 |
0.3758 times |
Fri 30 May 2025 |
124.10 (4.33%) |
111.70 |
109.00 - 148.75 |
3.1315 times |
Wed 30 April 2025 |
118.95 (-5.14%) |
124.90 |
103.20 - 130.00 |
0.9395 times |
Fri 28 March 2025 |
125.40 (19.43%) |
103.50 |
97.50 - 127.00 |
1.348 times |
Fri 28 February 2025 |
105.00 (-2.23%) |
110.10 |
97.75 - 118.00 |
0.6412 times |
Fri 31 January 2025 |
107.40 (-4.96%) |
126.00 |
98.20 - 135.00 |
1.6254 times |
Mon 30 December 2024 |
113.00 (0.44%) |
112.00 |
95.55 - 130.50 |
1.19 times |

DMA SMA EMA moving averages of Mahickra Chemical MAHICKRA_SM
DMA (daily moving average) of Mahickra Chemical MAHICKRA_SM
| DMA period | DMA value | | 5 day DMA | 161.09 | | 12 day DMA | 157.46 | | 20 day DMA | 157.02 | | 35 day DMA | 155.33 | | 50 day DMA | 151.96 | | 100 day DMA | 140.57 | | 150 day DMA | 131.08 | | 200 day DMA | 125.31 | EMA (exponential moving average) of Mahickra Chemical MAHICKRA_SM
| EMA period | EMA current | EMA prev | EMA prev2 | | 5 day EMA | 159.43 | 160 | 159.55 | | 12 day EMA | 158.14 | 158.11 | 157.6 | | 20 day EMA | 156.93 | 156.79 | 156.36 | | 35 day EMA | 154.13 | 153.88 | 153.47 | | 50 day EMA | 151.78 | 151.51 | 151.13 |
SMA (simple moving average) of Mahickra Chemical MAHICKRA_SM
| SMA period | SMA current | SMA prev | SMA prev2 | | 5 day SMA | 161.09 | 160.23 | 158.57 | | 12 day SMA | 157.46 | 157.01 | 156.37 | | 20 day SMA | 157.02 | 156.99 | 156.94 | | 35 day SMA | 155.33 | 155.03 | 155.07 | | 50 day SMA | 151.96 | 151.55 | 151.07 | | 100 day SMA | 140.57 | 140.44 | 140.2 | | 150 day SMA | 131.08 | 130.74 | 130.38 | | 200 day SMA | 125.31 | 125.09 | 124.83 |
|
|
