LuxIndustries LUXIND full analysis,charts,indicators,moving averages,SMA,DMA,EMA,ADX,MACD,RSILux Industries LUXIND WideScreen charts, DMA,SMA,EMA technical analysis, forecast prediction, by indicators ADX,MACD,RSI,CCI NSE stock exchange
Daily price and charts and targets LuxIndustries Strong Daily Stock price targets for LuxIndustries LUXIND are 1270.05 and 1284.45 | Daily Target 1 | 1267.23 | | Daily Target 2 | 1272.87 | | Daily Target 3 | 1281.6333333333 | | Daily Target 4 | 1287.27 | | Daily Target 5 | 1296.03 |
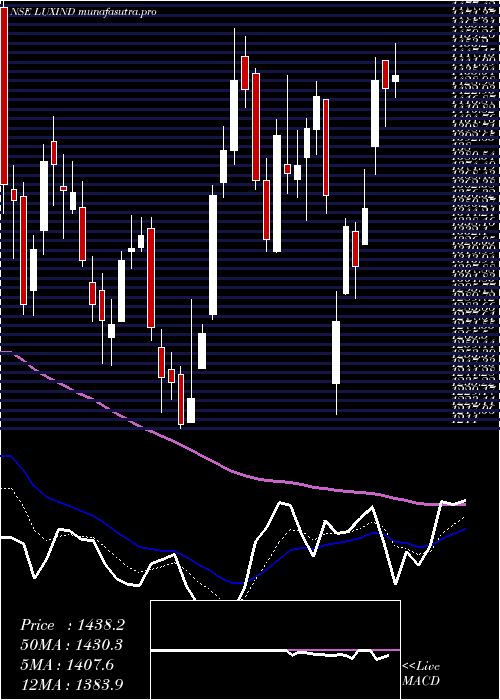
Daily price and volume Lux Industries
| Date |
Closing |
Open |
Range |
Volume |
Tue 28 October 2025 |
1278.50 (-0.58%) |
1283.40 |
1276.00 - 1290.40 |
1.175 times |
Mon 27 October 2025 |
1285.90 (-0.52%) |
1300.00 |
1282.60 - 1300.00 |
1.0329 times |
Fri 24 October 2025 |
1292.60 (-0.28%) |
1319.00 |
1286.40 - 1319.00 |
1.6763 times |
Thu 23 October 2025 |
1296.20 (0.05%) |
1300.00 |
1291.00 - 1308.00 |
1.1098 times |
Tue 21 October 2025 |
1295.50 (1.62%) |
1276.70 |
1276.70 - 1306.40 |
0.3948 times |
Mon 20 October 2025 |
1274.80 (-0.48%) |
1283.30 |
1262.10 - 1324.90 |
1.2886 times |
Fri 17 October 2025 |
1281.00 (-0.91%) |
1298.00 |
1277.90 - 1298.00 |
1.0969 times |
Thu 16 October 2025 |
1292.80 (-0.24%) |
1295.00 |
1285.00 - 1300.00 |
0.9986 times |
Wed 15 October 2025 |
1295.90 (0.08%) |
1295.20 |
1290.00 - 1299.90 |
0.4931 times |
Tue 14 October 2025 |
1294.80 (-0.4%) |
1290.00 |
1282.00 - 1315.00 |
0.7339 times |
Mon 13 October 2025 |
1300.00 (0.62%) |
1290.00 |
1284.10 - 1315.40 |
1.2607 times |
Weekly price and charts LuxIndustries Strong weekly Stock price targets for LuxIndustries LUXIND are 1265.25 and 1289.25 | Weekly Target 1 | 1260.83 | | Weekly Target 2 | 1269.67 | | Weekly Target 3 | 1284.8333333333 | | Weekly Target 4 | 1293.67 | | Weekly Target 5 | 1308.83 |
Weekly price and volumes for Lux Industries
| Date |
Closing |
Open |
Range |
Volume |
Tue 28 October 2025 |
1278.50 (-1.09%) |
1300.00 |
1276.00 - 1300.00 |
0.3411 times |
Fri 24 October 2025 |
1292.60 (0.91%) |
1283.30 |
1262.10 - 1324.90 |
0.6904 times |
Fri 17 October 2025 |
1281.00 (-0.85%) |
1290.00 |
1277.90 - 1315.40 |
0.708 times |
Fri 10 October 2025 |
1292.00 (-1.07%) |
1312.70 |
1271.50 - 1314.00 |
0.763 times |
Fri 03 October 2025 |
1306.00 (-0.12%) |
1315.00 |
1268.10 - 1329.90 |
0.6705 times |
Fri 26 September 2025 |
1307.60 (-5.11%) |
1380.00 |
1299.90 - 1399.90 |
0.8789 times |
Fri 19 September 2025 |
1378.00 (4.89%) |
1325.00 |
1300.10 - 1439.90 |
3.9412 times |
Fri 12 September 2025 |
1313.80 (0.91%) |
1310.00 |
1281.00 - 1335.90 |
0.816 times |
Fri 05 September 2025 |
1302.00 (2.1%) |
1270.80 |
1270.80 - 1329.10 |
0.7426 times |
Fri 29 August 2025 |
1275.20 (-2.09%) |
1300.00 |
1270.00 - 1308.50 |
0.4484 times |
Fri 22 August 2025 |
1302.40 (1.13%) |
1288.00 |
1288.00 - 1357.20 |
0.867 times |

Monthly price and charts LuxIndustries Strong monthly Stock price targets for LuxIndustries LUXIND are 1238.9 and 1301.7 | Monthly Target 1 | 1225.7 | | Monthly Target 2 | 1252.1 | | Monthly Target 3 | 1288.5 | | Monthly Target 4 | 1314.9 | | Monthly Target 5 | 1351.3 |
Monthly price and volumes Lux Industries
| Date |
Closing |
Open |
Range |
Volume |
Tue 28 October 2025 |
1278.50 (-0.15%) |
1288.00 |
1262.10 - 1324.90 |
0.34 times |
Tue 30 September 2025 |
1280.40 (0.41%) |
1270.80 |
1268.10 - 1439.90 |
0.8173 times |
Fri 29 August 2025 |
1275.20 (-7.53%) |
1370.00 |
1251.00 - 1392.10 |
0.3985 times |
Thu 31 July 2025 |
1379.00 (-5.43%) |
1465.00 |
1366.30 - 1524.70 |
0.6482 times |
Mon 30 June 2025 |
1458.20 (-1.42%) |
1493.30 |
1390.00 - 1555.00 |
0.7094 times |
Fri 30 May 2025 |
1479.20 (7.81%) |
1370.00 |
1303.80 - 1645.80 |
1.3375 times |
Wed 30 April 2025 |
1372.00 (-0.24%) |
1371.25 |
1220.00 - 1467.50 |
0.967 times |
Fri 28 March 2025 |
1375.35 (6.53%) |
1300.40 |
1211.00 - 1469.00 |
1.672 times |
Fri 28 February 2025 |
1291.10 (-17.62%) |
1518.60 |
1280.00 - 1628.00 |
1.1584 times |
Fri 31 January 2025 |
1567.25 (-22.08%) |
2011.00 |
1483.55 - 2146.00 |
1.9516 times |
Tue 31 December 2024 |
2011.30 (4.67%) |
1950.00 |
1860.15 - 2174.00 |
1.8528 times |

DMA SMA EMA moving averages of Lux Industries LUXIND
DMA (daily moving average) of Lux Industries LUXIND
| DMA period | DMA value | | 5 day DMA | 1289.74 | | 12 day DMA | 1290 | | 20 day DMA | 1292.7 | | 35 day DMA | 1312.75 | | 50 day DMA | 1310.51 | | 100 day DMA | 1370.02 | | 150 day DMA | 1391.21 | | 200 day DMA | 1417.1 | EMA (exponential moving average) of Lux Industries LUXIND
| EMA period | EMA current | EMA prev | EMA prev2 | | 5 day EMA | 1285.97 | 1289.71 | 1291.61 | | 12 day EMA | 1290.76 | 1292.99 | 1294.28 | | 20 day EMA | 1296.38 | 1298.26 | 1299.56 | | 35 day EMA | 1300.32 | 1301.6 | 1302.52 | | 50 day EMA | 1307.79 | 1308.99 | 1309.93 |
SMA (simple moving average) of Lux Industries LUXIND
| SMA period | SMA current | SMA prev | SMA prev2 | | 5 day SMA | 1289.74 | 1289 | 1288.02 | | 12 day SMA | 1290 | 1290.7 | 1291.08 | | 20 day SMA | 1292.7 | 1294.16 | 1296.39 | | 35 day SMA | 1312.75 | 1313.42 | 1313.83 | | 50 day SMA | 1310.51 | 1310.42 | 1310.48 | | 100 day SMA | 1370.02 | 1372.49 | 1374.66 | | 150 day SMA | 1391.21 | 1391.76 | 1391.67 | | 200 day SMA | 1417.1 | 1420.18 | 1423.9 |
|
|
