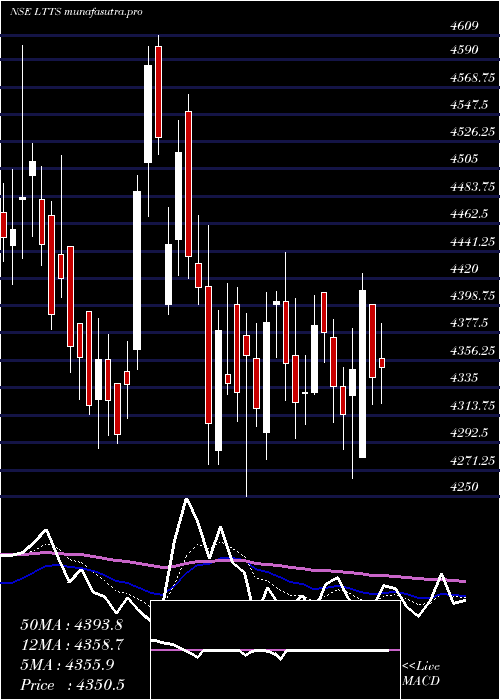
LT LTTS full analysis,charts,indicators,moving averages,SMA,DMA,EMA,ADX,MACD,RSIL T LTTS WideScreen charts, DMA,SMA,EMA technical analysis, forecast prediction, by indicators ADX,MACD,RSI,CCI NSE stock exchange
Daily price and charts and targets LT Strong Daily Stock price targets for LT LTTS are 4094.85 and 4169.75 | Daily Target 1 | 4081.6 | | Daily Target 2 | 4108.1 | | Daily Target 3 | 4156.5 | | Daily Target 4 | 4183 | | Daily Target 5 | 4231.4 |
Daily price and volume L T
| Date |
Closing |
Open |
Range |
Volume |
Tue 28 October 2025 |
4134.60 (-1.43%) |
4204.90 |
4130.00 - 4204.90 |
1.1783 times |
Mon 27 October 2025 |
4194.40 (0.52%) |
4175.00 |
4142.10 - 4220.00 |
1.3215 times |
Fri 24 October 2025 |
4172.70 (-0.74%) |
4220.00 |
4155.00 - 4220.00 |
0.6605 times |
Thu 23 October 2025 |
4203.70 (-0.03%) |
4250.00 |
4191.40 - 4256.80 |
1.5425 times |
Tue 21 October 2025 |
4204.90 (0.12%) |
4235.00 |
4190.60 - 4235.00 |
0.1616 times |
Mon 20 October 2025 |
4199.70 (1.08%) |
4210.00 |
4150.00 - 4219.00 |
1.4236 times |
Fri 17 October 2025 |
4154.70 (-1%) |
4213.50 |
4130.00 - 4213.50 |
0.9652 times |
Thu 16 October 2025 |
4196.80 (1.51%) |
4167.00 |
4141.90 - 4212.00 |
0.7057 times |
Wed 15 October 2025 |
4134.50 (-0.44%) |
4184.60 |
4119.00 - 4199.20 |
1.0639 times |
Tue 14 October 2025 |
4152.70 (-0.98%) |
4202.20 |
4128.00 - 4225.40 |
0.9772 times |
Mon 13 October 2025 |
4193.80 (-2.86%) |
4252.00 |
4181.00 - 4299.30 |
1.0987 times |
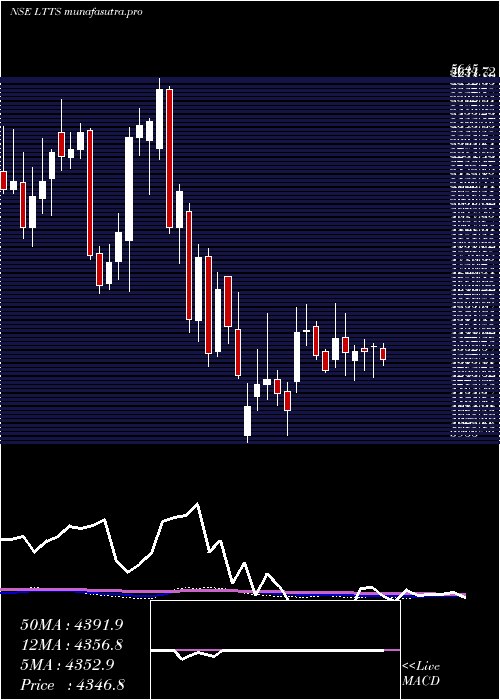
Weekly price and charts LT Strong weekly Stock price targets for LT LTTS are 4087.3 and 4177.3 | Weekly Target 1 | 4071.53 | | Weekly Target 2 | 4103.07 | | Weekly Target 3 | 4161.5333333333 | | Weekly Target 4 | 4193.07 | | Weekly Target 5 | 4251.53 |
Weekly price and volumes for L T
| Date |
Closing |
Open |
Range |
Volume |
Tue 28 October 2025 |
4134.60 (-0.91%) |
4175.00 |
4130.00 - 4220.00 |
0.4742 times |
Fri 24 October 2025 |
4172.70 (0.43%) |
4210.00 |
4150.00 - 4256.80 |
0.7187 times |
Fri 17 October 2025 |
4154.70 (-3.76%) |
4252.00 |
4119.00 - 4299.30 |
0.9126 times |
Fri 10 October 2025 |
4317.10 (0.64%) |
4289.70 |
4209.30 - 4331.50 |
0.7166 times |
Fri 03 October 2025 |
4289.70 (5.69%) |
4066.00 |
3951.30 - 4296.40 |
0.9013 times |
Fri 26 September 2025 |
4058.90 (-6.59%) |
4269.90 |
4034.10 - 4295.80 |
1.0282 times |
Fri 19 September 2025 |
4345.40 (3.05%) |
4225.00 |
4182.50 - 4497.00 |
2.0602 times |
Fri 12 September 2025 |
4216.60 (2.33%) |
4149.00 |
4081.00 - 4252.00 |
1.0314 times |
Fri 05 September 2025 |
4120.60 (-2.44%) |
4216.50 |
4090.00 - 4281.60 |
1.1999 times |
Fri 29 August 2025 |
4223.50 (-1.19%) |
4304.00 |
4202.00 - 4421.00 |
0.957 times |
Fri 22 August 2025 |
4274.20 (2.9%) |
4198.00 |
4148.00 - 4315.00 |
0.779 times |
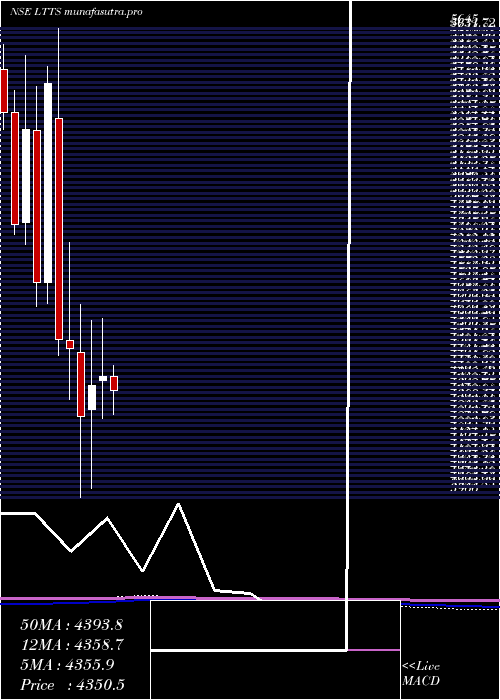
Monthly price and charts LT Strong monthly Stock price targets for LT LTTS are 4007.05 and 4233.05 | Monthly Target 1 | 3964.53 | | Monthly Target 2 | 4049.57 | | Monthly Target 3 | 4190.5333333333 | | Monthly Target 4 | 4275.57 | | Monthly Target 5 | 4416.53 |
Monthly price and volumes L T
| Date |
Closing |
Open |
Range |
Volume |
Tue 28 October 2025 |
4134.60 (0.5%) |
4150.00 |
4105.50 - 4331.50 |
0.3642 times |
Tue 30 September 2025 |
4113.90 (-2.6%) |
4216.50 |
3951.30 - 4497.00 |
0.6572 times |
Fri 29 August 2025 |
4223.50 (-1.97%) |
4304.20 |
4125.00 - 4421.00 |
0.3587 times |
Thu 31 July 2025 |
4308.20 (-2.13%) |
4402.10 |
4171.80 - 4500.00 |
0.8317 times |
Mon 30 June 2025 |
4402.10 (0.79%) |
4385.00 |
4250.00 - 4609.00 |
0.9707 times |
Fri 30 May 2025 |
4367.60 (2.6%) |
4284.00 |
4000.00 - 4600.60 |
0.9971 times |
Wed 30 April 2025 |
4257.10 (-5.43%) |
4487.75 |
3966.00 - 4659.50 |
1.3091 times |
Fri 28 March 2025 |
4501.70 (-0.69%) |
4530.10 |
4317.55 - 4879.75 |
1.2254 times |
Fri 28 February 2025 |
4533.20 (-16.81%) |
5325.00 |
4475.65 - 5645.00 |
1.2585 times |
Fri 31 January 2025 |
5449.35 (15.03%) |
4737.40 |
4660.80 - 5509.00 |
2.0275 times |
Tue 31 December 2024 |
4737.40 (-10.36%) |
5280.00 |
4652.05 - 5439.00 |
0.8742 times |
DMA SMA EMA moving averages of L T LTTS
DMA (daily moving average) of L T LTTS
| DMA period | DMA value | | 5 day DMA | 4182.06 | | 12 day DMA | 4188.3 | | 20 day DMA | 4197.3 | | 35 day DMA | 4199.89 | | 50 day DMA | 4207.47 | | 100 day DMA | 4271.78 | | 150 day DMA | 4303.02 | | 200 day DMA | 4480.59 | EMA (exponential moving average) of L T LTTS
| EMA period | EMA current | EMA prev | EMA prev2 | | 5 day EMA | 4171.77 | 4190.35 | 4188.32 | | 12 day EMA | 4185.92 | 4195.25 | 4195.41 | | 20 day EMA | 4192.76 | 4198.88 | 4199.35 | | 35 day EMA | 4199.06 | 4202.86 | 4203.36 | | 50 day EMA | 4201.82 | 4204.56 | 4204.97 |
SMA (simple moving average) of L T LTTS
| SMA period | SMA current | SMA prev | SMA prev2 | | 5 day SMA | 4182.06 | 4195.08 | 4187.14 | | 12 day SMA | 4188.3 | 4199.97 | 4203.06 | | 20 day SMA | 4197.3 | 4193.51 | 4189.83 | | 35 day SMA | 4199.89 | 4199.49 | 4198.88 | | 50 day SMA | 4207.47 | 4207.55 | 4207.44 | | 100 day SMA | 4271.78 | 4274 | 4275.27 | | 150 day SMA | 4303.02 | 4306.44 | 4309.21 | | 200 day SMA | 4480.59 | 4483.73 | 4486.74 |
|
|
