LtFoods LTFOODS full analysis,charts,indicators,moving averages,SMA,DMA,EMA,ADX,MACD,RSILt Foods LTFOODS WideScreen charts, DMA,SMA,EMA technical analysis, forecast prediction, by indicators ADX,MACD,RSI,CCI NSE stock exchange
Daily price and charts and targets LtFoods Strong Daily Stock price targets for LtFoods LTFOODS are 410.63 and 420.08 | Daily Target 1 | 408.93 | | Daily Target 2 | 412.32 | | Daily Target 3 | 418.38333333333 | | Daily Target 4 | 421.77 | | Daily Target 5 | 427.83 |
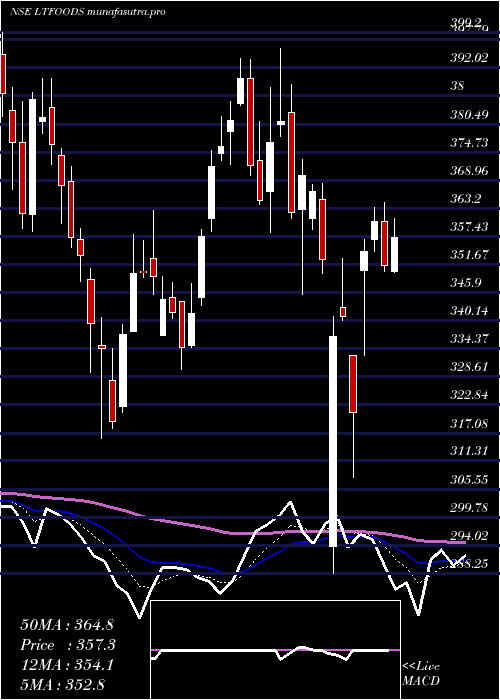
Daily price and volume Lt Foods
| Date |
Closing |
Open |
Range |
Volume |
Tue 28 October 2025 |
415.70 (-1.7%) |
422.85 |
415.00 - 424.45 |
0.3824 times |
Mon 27 October 2025 |
422.90 (-0.72%) |
427.95 |
420.50 - 428.00 |
0.6409 times |
Fri 24 October 2025 |
425.95 (0.11%) |
427.45 |
420.15 - 429.80 |
0.8175 times |
Thu 23 October 2025 |
425.50 (-1.25%) |
433.05 |
421.50 - 433.75 |
1.3178 times |
Tue 21 October 2025 |
430.90 (1.96%) |
426.25 |
425.15 - 432.40 |
0.4667 times |
Mon 20 October 2025 |
422.60 (0.81%) |
422.85 |
409.75 - 423.85 |
1.1423 times |
Fri 17 October 2025 |
419.20 (1.33%) |
415.00 |
410.55 - 423.00 |
1.1719 times |
Thu 16 October 2025 |
413.70 (0.22%) |
415.00 |
405.00 - 415.90 |
0.9799 times |
Wed 15 October 2025 |
412.80 (1.33%) |
409.05 |
407.00 - 418.75 |
1.5811 times |
Tue 14 October 2025 |
407.40 (1.77%) |
401.00 |
396.75 - 409.90 |
1.4995 times |
Mon 13 October 2025 |
400.30 (-0.44%) |
402.00 |
391.10 - 402.25 |
0.8503 times |
Weekly price and charts LtFoods Strong weekly Stock price targets for LtFoods LTFOODS are 408.85 and 421.85 | Weekly Target 1 | 406.57 | | Weekly Target 2 | 411.13 | | Weekly Target 3 | 419.56666666667 | | Weekly Target 4 | 424.13 | | Weekly Target 5 | 432.57 |
Weekly price and volumes for Lt Foods
| Date |
Closing |
Open |
Range |
Volume |
Tue 28 October 2025 |
415.70 (-2.41%) |
427.95 |
415.00 - 428.00 |
0.2106 times |
Fri 24 October 2025 |
425.95 (1.61%) |
422.85 |
409.75 - 433.75 |
0.7707 times |
Fri 17 October 2025 |
419.20 (4.27%) |
402.00 |
391.10 - 423.00 |
1.252 times |
Fri 10 October 2025 |
402.05 (-0.45%) |
404.00 |
384.00 - 405.20 |
1.1386 times |
Fri 03 October 2025 |
403.85 (-2.86%) |
417.75 |
398.00 - 418.00 |
1.034 times |
Fri 26 September 2025 |
415.75 (-12.06%) |
472.60 |
412.00 - 473.30 |
1.6097 times |
Fri 19 September 2025 |
472.75 (2.15%) |
461.80 |
454.00 - 480.00 |
0.9304 times |
Fri 12 September 2025 |
462.80 (4.45%) |
443.55 |
438.10 - 468.00 |
1.0422 times |
Fri 05 September 2025 |
443.10 (5.16%) |
422.00 |
421.35 - 460.00 |
0.8456 times |
Fri 29 August 2025 |
421.35 (-2.83%) |
433.60 |
420.00 - 443.15 |
1.1661 times |
Fri 22 August 2025 |
433.60 (-2.73%) |
450.95 |
430.25 - 458.50 |
0.7602 times |

Monthly price and charts LtFoods Strong monthly Stock price targets for LtFoods LTFOODS are 399.85 and 449.6 | Monthly Target 1 | 361.4 | | Monthly Target 2 | 388.55 | | Monthly Target 3 | 411.15 | | Monthly Target 4 | 438.3 | | Monthly Target 5 | 460.9 |
Monthly price and volumes Lt Foods
| Date |
Closing |
Open |
Range |
Volume |
Tue 28 October 2025 |
415.70 (2.49%) |
407.60 |
384.00 - 433.75 |
0.707 times |
Tue 30 September 2025 |
405.60 (-3.74%) |
422.00 |
398.00 - 480.00 |
0.9011 times |
Fri 29 August 2025 |
421.35 (-13.38%) |
485.50 |
420.00 - 490.05 |
0.6879 times |
Thu 31 July 2025 |
486.45 (0%) |
485.00 |
465.90 - 518.55 |
1.417 times |
Mon 30 June 2025 |
486.45 (10.58%) |
439.90 |
389.20 - 498.70 |
2.3516 times |
Fri 30 May 2025 |
439.90 (26.94%) |
345.05 |
330.00 - 441.85 |
1.1237 times |
Wed 30 April 2025 |
346.55 (-9.04%) |
382.75 |
288.25 - 388.60 |
0.9899 times |
Fri 28 March 2025 |
381.00 (12.21%) |
335.00 |
316.00 - 396.00 |
0.6279 times |
Fri 28 February 2025 |
339.55 (-12.96%) |
385.30 |
329.55 - 411.40 |
0.5052 times |
Fri 31 January 2025 |
390.10 (-6.92%) |
422.10 |
326.05 - 441.75 |
0.6887 times |
Tue 31 December 2024 |
419.10 (5.54%) |
397.10 |
391.10 - 451.60 |
0.6821 times |

DMA SMA EMA moving averages of Lt Foods LTFOODS
DMA (daily moving average) of Lt Foods LTFOODS
| DMA period | DMA value | | 5 day DMA | 424.19 | | 12 day DMA | 416.58 | | 20 day DMA | 409.32 | | 35 day DMA | 426.52 | | 50 day DMA | 430.54 | | 100 day DMA | 452.12 | | 150 day DMA | 426.26 | | 200 day DMA | 413.67 | EMA (exponential moving average) of Lt Foods LTFOODS
| EMA period | EMA current | EMA prev | EMA prev2 | | 5 day EMA | 420.75 | 423.27 | 423.45 | | 12 day EMA | 418.25 | 418.71 | 417.95 | | 20 day EMA | 418.75 | 419.07 | 418.67 | | 35 day EMA | 423.4 | 423.85 | 423.91 | | 50 day EMA | 432.26 | 432.94 | 433.35 |
SMA (simple moving average) of Lt Foods LTFOODS
| SMA period | SMA current | SMA prev | SMA prev2 | | 5 day SMA | 424.19 | 425.57 | 424.83 | | 12 day SMA | 416.58 | 414.18 | 411.79 | | 20 day SMA | 409.32 | 409.33 | 409.46 | | 35 day SMA | 426.52 | 427.31 | 427.82 | | 50 day SMA | 430.54 | 431.41 | 432.08 | | 100 day SMA | 452.12 | 452.4 | 452.63 | | 150 day SMA | 426.26 | 425.97 | 425.53 | | 200 day SMA | 413.67 | 413.63 | 413.67 |
|
|
