LandmarkProperty LPDC full analysis,charts,indicators,moving averages,SMA,DMA,EMA,ADX,MACD,RSILandmark Property LPDC WideScreen charts, DMA,SMA,EMA technical analysis, forecast prediction, by indicators ADX,MACD,RSI,CCI NSE stock exchange
operates under Realty sector
Daily price and charts and targets LandmarkProperty Strong Daily Stock price targets for LandmarkProperty LPDC are 8.22 and 8.45 | Daily Target 1 | 8.03 | | Daily Target 2 | 8.18 | | Daily Target 3 | 8.2633333333333 | | Daily Target 4 | 8.41 | | Daily Target 5 | 8.49 |
Daily price and volume Landmark Property
| Date |
Closing |
Open |
Range |
Volume |
Wed 29 October 2025 |
8.32 (2.09%) |
8.29 |
8.12 - 8.35 |
1.4363 times |
Tue 28 October 2025 |
8.15 (0.37%) |
8.28 |
8.01 - 8.28 |
1.1864 times |
Mon 27 October 2025 |
8.12 (-0.25%) |
8.30 |
8.09 - 8.35 |
1.2038 times |
Fri 24 October 2025 |
8.14 (0.62%) |
8.19 |
8.05 - 8.39 |
0.8236 times |
Thu 23 October 2025 |
8.09 (-2.41%) |
8.30 |
8.02 - 8.40 |
0.4114 times |
Tue 21 October 2025 |
8.29 (2.22%) |
8.00 |
8.00 - 8.35 |
0.3097 times |
Mon 20 October 2025 |
8.11 (0.62%) |
7.90 |
7.90 - 8.30 |
0.8231 times |
Fri 17 October 2025 |
8.06 (0.88%) |
7.85 |
7.85 - 8.16 |
0.6877 times |
Thu 16 October 2025 |
7.99 (-3.03%) |
8.24 |
7.86 - 8.25 |
2.2228 times |
Wed 15 October 2025 |
8.24 (1.85%) |
8.15 |
8.00 - 8.29 |
0.8951 times |
Tue 14 October 2025 |
8.09 (-0.49%) |
8.02 |
8.02 - 8.25 |
1.1001 times |
Weekly price and charts LandmarkProperty Strong weekly Stock price targets for LandmarkProperty LPDC are 8.17 and 8.51 | Weekly Target 1 | 7.89 | | Weekly Target 2 | 8.1 | | Weekly Target 3 | 8.2266666666667 | | Weekly Target 4 | 8.44 | | Weekly Target 5 | 8.57 |
Weekly price and volumes for Landmark Property
| Date |
Closing |
Open |
Range |
Volume |
Wed 29 October 2025 |
8.32 (2.21%) |
8.30 |
8.01 - 8.35 |
0.7569 times |
Fri 24 October 2025 |
8.14 (0.99%) |
7.90 |
7.90 - 8.40 |
0.4683 times |
Fri 17 October 2025 |
8.06 (-4.39%) |
8.39 |
7.85 - 8.40 |
1.1523 times |
Fri 10 October 2025 |
8.43 (1.69%) |
8.30 |
7.94 - 8.68 |
1.8624 times |
Fri 03 October 2025 |
8.29 (7.66%) |
7.60 |
7.60 - 8.59 |
1.6651 times |
Fri 26 September 2025 |
7.70 (-0.39%) |
7.97 |
7.53 - 8.15 |
0.9659 times |
Fri 19 September 2025 |
7.73 (0.26%) |
7.62 |
7.61 - 7.97 |
1.1688 times |
Fri 12 September 2025 |
7.71 (-1.78%) |
7.95 |
7.52 - 8.00 |
0.6792 times |
Fri 05 September 2025 |
7.85 (-1.13%) |
7.67 |
7.56 - 8.19 |
0.8247 times |
Fri 29 August 2025 |
7.94 (0.63%) |
7.61 |
7.61 - 8.28 |
0.4563 times |
Fri 22 August 2025 |
7.89 (2.87%) |
7.60 |
7.60 - 8.19 |
0.853 times |

Monthly price and charts LandmarkProperty Strong monthly Stock price targets for LandmarkProperty LPDC are 7.67 and 8.5 | Monthly Target 1 | 7.45 | | Monthly Target 2 | 7.89 | | Monthly Target 3 | 8.2833333333333 | | Monthly Target 4 | 8.72 | | Monthly Target 5 | 9.11 |
Monthly price and volumes Landmark Property
| Date |
Closing |
Open |
Range |
Volume |
Wed 29 October 2025 |
8.32 (0.24%) |
8.47 |
7.85 - 8.68 |
0.5066 times |
Tue 30 September 2025 |
8.30 (4.53%) |
7.67 |
7.52 - 8.49 |
0.4459 times |
Fri 29 August 2025 |
7.94 (-3.99%) |
8.10 |
7.40 - 8.45 |
0.3372 times |
Thu 31 July 2025 |
8.27 (-6.24%) |
8.56 |
7.70 - 9.12 |
0.5317 times |
Mon 30 June 2025 |
8.82 (6.01%) |
8.13 |
8.06 - 10.16 |
1.1631 times |
Fri 30 May 2025 |
8.32 (0.85%) |
8.26 |
7.29 - 8.79 |
0.6023 times |
Wed 30 April 2025 |
8.25 (14.42%) |
7.15 |
6.96 - 10.15 |
0.8983 times |
Fri 28 March 2025 |
7.21 (-47.06%) |
8.49 |
7.15 - 8.49 |
0.0887 times |
Wed 11 December 2024 |
13.62 (38.13%) |
10.11 |
9.89 - 15.30 |
4.4364 times |
Fri 29 November 2024 |
9.86 (-1.3%) |
10.22 |
8.25 - 10.60 |
0.9898 times |
Thu 31 October 2024 |
9.99 (-40.39%) |
10.75 |
9.65 - 12.49 |
2.1316 times |

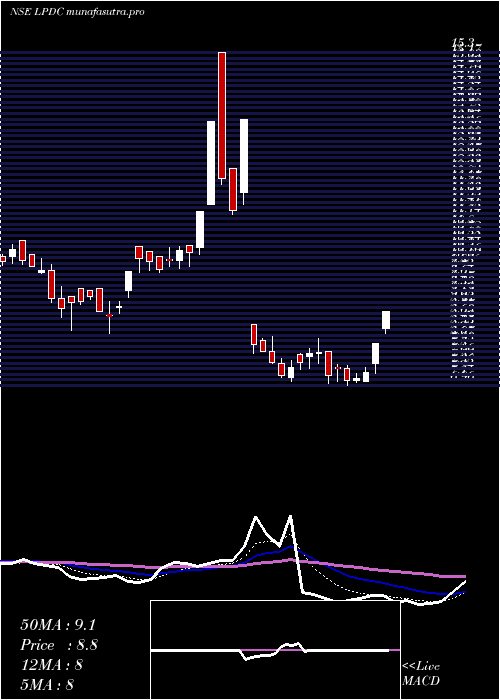
DMA SMA EMA moving averages of Landmark Property LPDC
DMA (daily moving average) of Landmark Property LPDC
| DMA period | DMA value | | 5 day DMA | 8.16 | | 12 day DMA | 8.14 | | 20 day DMA | 8.2 | | 35 day DMA | 8.01 | | 50 day DMA | 7.98 | | 100 day DMA | 8.24 | | 150 day DMA | 8.26 | | 200 day DMA | 8.8 | EMA (exponential moving average) of Landmark Property LPDC
| EMA period | EMA current | EMA prev | EMA prev2 | | 5 day EMA | 8.2 | 8.14 | 8.13 | | 12 day EMA | 8.17 | 8.14 | 8.14 | | 20 day EMA | 8.12 | 8.1 | 8.1 | | 35 day EMA | 8.07 | 8.06 | 8.05 | | 50 day EMA | 7.97 | 7.96 | 7.95 |
SMA (simple moving average) of Landmark Property LPDC
| SMA period | SMA current | SMA prev | SMA prev2 | | 5 day SMA | 8.16 | 8.16 | 8.15 | | 12 day SMA | 8.14 | 8.15 | 8.17 | | 20 day SMA | 8.2 | 8.17 | 8.15 | | 35 day SMA | 8.01 | 7.99 | 7.98 | | 50 day SMA | 7.98 | 7.97 | 7.95 | | 100 day SMA | 8.24 | 8.24 | 8.24 | | 150 day SMA | 8.26 | 8.29 | 8.33 | | 200 day SMA | 8.8 | 8.81 | 8.82 |
|
|
