MiraeamcLiquidplus LIQUIDPLUS full analysis,charts,indicators,moving averages,SMA,DMA,EMA,ADX,MACD,RSIMiraeamc Liquidplus LIQUIDPLUS WideScreen charts, DMA,SMA,EMA technical analysis, forecast prediction, by indicators ADX,MACD,RSI,CCI NSE stock exchange
Daily price and charts and targets MiraeamcLiquidplus Strong Daily Stock price targets for MiraeamcLiquidplus LIQUIDPLUS are 1056.89 and 1056.91 | Daily Target 1 | 1056.89 | | Daily Target 2 | 1056.89 | | Daily Target 3 | 1056.9066666667 | | Daily Target 4 | 1056.91 | | Daily Target 5 | 1056.93 |
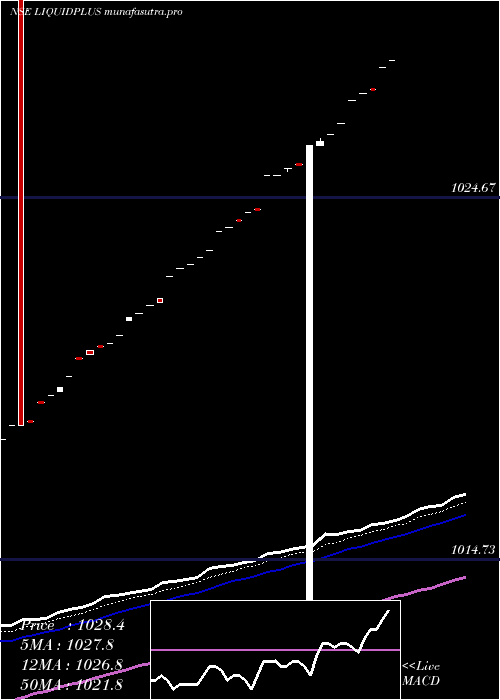
Daily price and volume Miraeamc Liquidplus
| Date |
Closing |
Open |
Range |
Volume |
Tue 28 October 2025 |
1056.90 (0.01%) |
1056.92 |
1056.90 - 1056.92 |
0.4626 times |
Mon 27 October 2025 |
1056.76 (0.02%) |
1056.75 |
1056.75 - 1056.77 |
0.5576 times |
Fri 24 October 2025 |
1056.59 (0.04%) |
1056.58 |
1056.58 - 1056.60 |
1.1862 times |
Thu 23 October 2025 |
1056.14 (0.01%) |
1056.13 |
1056.13 - 1056.15 |
0.7223 times |
Tue 21 October 2025 |
1055.99 (0%) |
1055.99 |
1055.99 - 1056.01 |
0.1837 times |
Mon 20 October 2025 |
1055.99 (0.04%) |
1056.01 |
1055.99 - 1056.01 |
0.6667 times |
Fri 17 October 2025 |
1055.52 (0.04%) |
1055.52 |
1055.52 - 1055.54 |
0.4762 times |
Thu 16 October 2025 |
1055.08 (0.01%) |
1055.07 |
1055.07 - 1055.09 |
3.0635 times |
Wed 15 October 2025 |
1054.93 (0.01%) |
1054.92 |
1054.92 - 1054.94 |
1.8659 times |
Tue 14 October 2025 |
1054.78 (0.01%) |
1054.77 |
1054.77 - 1054.79 |
0.8152 times |
Mon 13 October 2025 |
1054.63 (0.01%) |
1054.63 |
1054.63 - 1054.65 |
0.6154 times |
Weekly price and charts MiraeamcLiquidplus Strong weekly Stock price targets for MiraeamcLiquidplus LIQUIDPLUS are 1056.83 and 1057 | Weekly Target 1 | 1056.69 | | Weekly Target 2 | 1056.79 | | Weekly Target 3 | 1056.8566666667 | | Weekly Target 4 | 1056.96 | | Weekly Target 5 | 1057.03 |
Weekly price and volumes for Miraeamc Liquidplus
| Date |
Closing |
Open |
Range |
Volume |
Tue 28 October 2025 |
1056.90 (0.03%) |
1056.75 |
1056.75 - 1056.92 |
0.2335 times |
Fri 24 October 2025 |
1056.59 (0.1%) |
1056.01 |
1055.99 - 1056.60 |
0.6314 times |
Fri 17 October 2025 |
1055.52 (0.1%) |
1054.63 |
1054.63 - 1055.54 |
1.5645 times |
Fri 10 October 2025 |
1054.49 (0.1%) |
1053.59 |
1053.50 - 1054.50 |
1.4974 times |
Fri 03 October 2025 |
1053.41 (0.1%) |
1052.36 |
1052.36 - 1053.42 |
1.1038 times |
Fri 26 September 2025 |
1052.38 (0.1%) |
1051.46 |
1051.46 - 1052.40 |
1.0946 times |
Fri 19 September 2025 |
1051.33 (0.1%) |
1050.41 |
1046.56 - 1053.74 |
0.9478 times |
Fri 12 September 2025 |
1050.28 (0.08%) |
1049.39 |
1049.38 - 1050.29 |
0.9864 times |
Fri 05 September 2025 |
1049.40 (0.11%) |
1048.35 |
1048.35 - 1052.48 |
0.8419 times |
Fri 29 August 2025 |
1048.22 (0.1%) |
1047.32 |
1047.32 - 1048.23 |
1.0988 times |
Fri 22 August 2025 |
1047.17 (0.1%) |
1046.26 |
1046.26 - 1047.19 |
0.973 times |

Monthly price and charts MiraeamcLiquidplus Strong monthly Stock price targets for MiraeamcLiquidplus LIQUIDPLUS are 1054.93 and 1058.89 | Monthly Target 1 | 1051.63 | | Monthly Target 2 | 1054.27 | | Monthly Target 3 | 1055.5933333333 | | Monthly Target 4 | 1058.23 | | Monthly Target 5 | 1059.55 |
Monthly price and volumes Miraeamc Liquidplus
| Date |
Closing |
Open |
Range |
Volume |
Tue 28 October 2025 |
1056.90 (0.4%) |
1052.96 |
1052.96 - 1056.92 |
1.125 times |
Tue 30 September 2025 |
1052.68 (0.43%) |
1048.35 |
1046.56 - 1053.74 |
1.0351 times |
Fri 29 August 2025 |
1048.22 (0.44%) |
1044.07 |
1018.24 - 1048.23 |
1.1593 times |
Thu 31 July 2025 |
1043.61 (0.44%) |
1039.22 |
1039.20 - 1068.02 |
1.2527 times |
Mon 30 June 2025 |
1039.07 (0.41%) |
1035.00 |
1035.00 - 1039.08 |
0.4839 times |
Fri 30 May 2025 |
1034.86 (0.47%) |
1030.47 |
1029.06 - 1240.88 |
0.7837 times |
Wed 30 April 2025 |
1029.99 (0.46%) |
1025.29 |
994.83 - 1030.01 |
1.4844 times |
Fri 28 March 2025 |
1025.29 (0.5%) |
1020.42 |
1020.40 - 1025.29 |
0.714 times |
Fri 28 February 2025 |
1020.23 (0.47%) |
1015.67 |
1015.67 - 1038.75 |
0.8936 times |
Fri 31 January 2025 |
1015.49 (0.57%) |
1009.93 |
1009.93 - 1033.86 |
1.0684 times |
Tue 31 December 2024 |
1009.76 (0.52%) |
1004.66 |
1004.66 - 1009.78 |
0.0542 times |

DMA SMA EMA moving averages of Miraeamc Liquidplus LIQUIDPLUS
DMA (daily moving average) of Miraeamc Liquidplus LIQUIDPLUS
| DMA period | DMA value | | 5 day DMA | 1056.48 | | 12 day DMA | 1055.65 | | 20 day DMA | 1054.73 | | 35 day DMA | 1053.04 | | 50 day DMA | 1051.42 | | 100 day DMA | 1045.99 | | 150 day DMA | 1040.55 | | 200 day DMA | 1034.65 | EMA (exponential moving average) of Miraeamc Liquidplus LIQUIDPLUS
| EMA period | EMA current | EMA prev | EMA prev2 | | 5 day EMA | 1056.48 | 1056.27 | 1056.02 | | 12 day EMA | 1055.66 | 1055.44 | 1055.2 | | 20 day EMA | 1054.76 | 1054.53 | 1054.3 | | 35 day EMA | 1053.08 | 1052.85 | 1052.62 | | 50 day EMA | 1051.41 | 1051.19 | 1050.96 |
SMA (simple moving average) of Miraeamc Liquidplus LIQUIDPLUS
| SMA period | SMA current | SMA prev | SMA prev2 | | 5 day SMA | 1056.48 | 1056.29 | 1056.05 | | 12 day SMA | 1055.65 | 1055.41 | 1055.17 | | 20 day SMA | 1054.73 | 1054.5 | 1054.26 | | 35 day SMA | 1053.04 | 1052.83 | 1052.61 | | 50 day SMA | 1051.42 | 1051.19 | 1050.96 | | 100 day SMA | 1045.99 | 1045.77 | 1045.55 | | 150 day SMA | 1040.55 | 1040.32 | 1040.1 | | 200 day SMA | 1034.65 | 1034.42 | 1034.19 |
|
|
