GoldmanSachs LIQUIDBEES full analysis,charts,indicators,moving averages,SMA,DMA,EMA,ADX,MACD,RSIGoldman Sachs LIQUIDBEES WideScreen charts, DMA,SMA,EMA technical analysis, forecast prediction, by indicators ADX,MACD,RSI,CCI NSE stock exchange
Daily price and charts and targets GoldmanSachs Strong Daily Stock price targets for GoldmanSachs LIQUIDBEES are 1000 and 1000.86 | Daily Target 1 | 999.42 | | Daily Target 2 | 999.71 | | Daily Target 3 | 1000.28 | | Daily Target 4 | 1000.57 | | Daily Target 5 | 1001.14 |
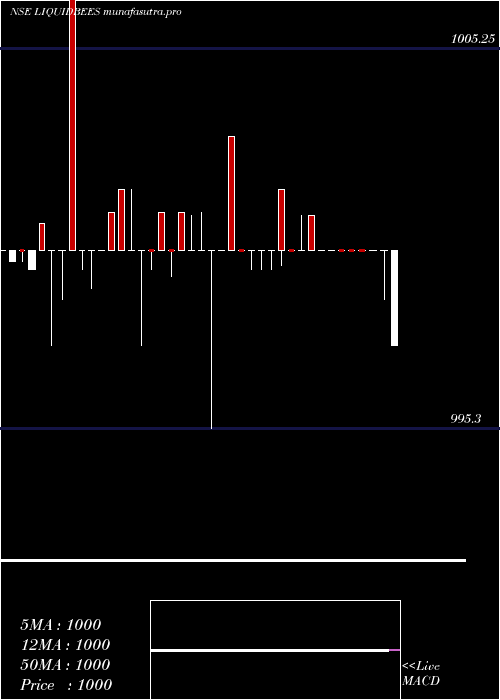
Daily price and volume Goldman Sachs
| Date |
Closing |
Open |
Range |
Volume |
Mon 27 October 2025 |
1000.00 (0%) |
999.99 |
999.99 - 1000.85 |
0.8068 times |
Fri 24 October 2025 |
1000.00 (0%) |
1000.77 |
999.63 - 1000.77 |
1.4152 times |
Thu 23 October 2025 |
999.99 (-0%) |
999.99 |
999.99 - 1000.01 |
1.2389 times |
Tue 21 October 2025 |
1000.00 (0%) |
999.99 |
999.56 - 1000.01 |
0.2554 times |
Mon 20 October 2025 |
1000.00 (0%) |
1000.00 |
999.56 - 1000.01 |
0.9437 times |
Fri 17 October 2025 |
1000.00 (0%) |
999.99 |
999.99 - 1000.01 |
1.7027 times |
Thu 16 October 2025 |
1000.00 (0%) |
1000.00 |
999.99 - 1000.01 |
0.8845 times |
Wed 15 October 2025 |
999.99 (0%) |
999.99 |
999.99 - 1000.01 |
0.8075 times |
Tue 14 October 2025 |
999.99 (0%) |
999.99 |
999.56 - 1000.01 |
0.9242 times |
Mon 13 October 2025 |
999.99 (-0%) |
1000.00 |
999.99 - 1000.97 |
1.021 times |
Fri 10 October 2025 |
1000.00 (0%) |
1000.00 |
999.99 - 1000.01 |
0.9038 times |
Weekly price and charts GoldmanSachs Strong weekly Stock price targets for GoldmanSachs LIQUIDBEES are 1000 and 1000.86 | Weekly Target 1 | 999.42 | | Weekly Target 2 | 999.71 | | Weekly Target 3 | 1000.28 | | Weekly Target 4 | 1000.57 | | Weekly Target 5 | 1001.14 |
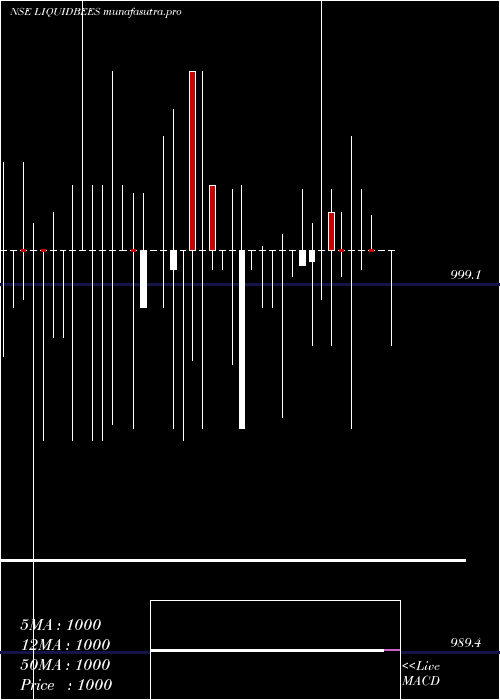
Weekly price and volumes for Goldman Sachs
| Date |
Closing |
Open |
Range |
Volume |
Mon 27 October 2025 |
1000.00 (0%) |
999.99 |
999.99 - 1000.85 |
0.1555 times |
Fri 24 October 2025 |
1000.00 (0%) |
1000.00 |
999.56 - 1000.77 |
0.7428 times |
Fri 17 October 2025 |
1000.00 (0%) |
1000.00 |
999.56 - 1000.97 |
1.0293 times |
Fri 10 October 2025 |
1000.00 (0%) |
999.99 |
998.61 - 1000.01 |
1.5519 times |
Fri 03 October 2025 |
1000.00 (0%) |
1000.00 |
999.56 - 1000.99 |
2.2466 times |
Fri 26 September 2025 |
1000.00 (0%) |
999.99 |
999.51 - 1000.25 |
0.8162 times |
Fri 19 September 2025 |
1000.00 (0%) |
999.56 |
999.56 - 1000.01 |
0.7021 times |
Fri 12 September 2025 |
1000.00 (0%) |
999.56 |
999.52 - 1000.77 |
0.8903 times |
Fri 05 September 2025 |
999.99 (-0%) |
1000.00 |
999.51 - 1000.01 |
0.9189 times |
Fri 29 August 2025 |
1000.00 (0%) |
999.11 |
999.11 - 1000.96 |
0.9465 times |
Fri 22 August 2025 |
1000.00 (0%) |
1000.00 |
998.00 - 1001.55 |
0.9469 times |
Monthly price and charts GoldmanSachs Strong monthly Stock price targets for GoldmanSachs LIQUIDBEES are 998.81 and 1001.19 | Monthly Target 1 | 997.49 | | Monthly Target 2 | 998.74 | | Monthly Target 3 | 999.86666666667 | | Monthly Target 4 | 1001.12 | | Monthly Target 5 | 1002.25 |
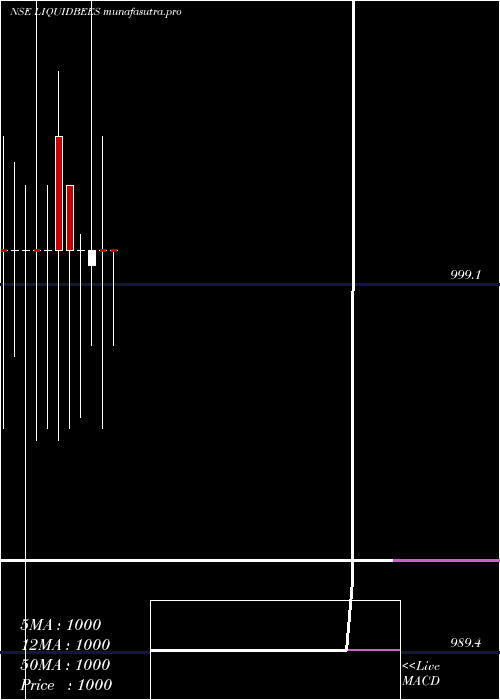
Monthly price and volumes Goldman Sachs
| Date |
Closing |
Open |
Range |
Volume |
Mon 27 October 2025 |
1000.00 (0%) |
1000.00 |
998.61 - 1000.99 |
0.9513 times |
Tue 30 September 2025 |
1000.00 (0%) |
1000.00 |
999.51 - 1000.77 |
0.7653 times |
Fri 29 August 2025 |
1000.00 (0%) |
999.99 |
998.00 - 1001.55 |
0.7483 times |
Thu 31 July 2025 |
1000.00 (0%) |
1000.00 |
997.50 - 1001.55 |
1.1787 times |
Mon 30 June 2025 |
999.99 (-0%) |
1000.00 |
970.00 - 1001.55 |
0.9077 times |
Fri 30 May 2025 |
1000.00 (0%) |
1000.01 |
999.11 - 1001.55 |
0.9779 times |
Wed 30 April 2025 |
1000.00 (0%) |
1000.00 |
997.50 - 1001.55 |
1.3905 times |
Fri 28 March 2025 |
1000.00 (0%) |
1000.01 |
995.30 - 1003.00 |
0.9367 times |
Fri 28 February 2025 |
1000.00 (0%) |
999.56 |
997.50 - 1030.00 |
0.8074 times |
Fri 31 January 2025 |
1000.00 (0%) |
1000.00 |
995.56 - 1000.36 |
1.3363 times |
Tue 31 December 2024 |
1000.00 (0%) |
1001.65 |
995.30 - 1001.65 |
0.9277 times |
DMA SMA EMA moving averages of Goldman Sachs LIQUIDBEES
DMA (daily moving average) of Goldman Sachs LIQUIDBEES
| DMA period | DMA value | | 5 day DMA | 1000 | | 12 day DMA | 1000 | | 20 day DMA | 1000 | | 35 day DMA | 1000 | | 50 day DMA | 1000 | | 100 day DMA | 1000 | | 150 day DMA | 1000 | | 200 day DMA | 1000 | EMA (exponential moving average) of Goldman Sachs LIQUIDBEES
| EMA period | EMA current | EMA prev | EMA prev2 | | 5 day EMA | 999.99 | 999.99 | 999.99 | | 12 day EMA | 1000 | 1000 | 1000 | | 20 day EMA | 999.99 | 999.99 | 999.99 | | 35 day EMA | 999.99 | 999.99 | 999.99 | | 50 day EMA | 999.99 | 999.99 | 999.99 |
SMA (simple moving average) of Goldman Sachs LIQUIDBEES
| SMA period | SMA current | SMA prev | SMA prev2 | | 5 day SMA | 1000 | 1000 | 1000 | | 12 day SMA | 1000 | 1000 | 1000 | | 20 day SMA | 1000 | 1000 | 1000 | | 35 day SMA | 1000 | 1000 | 1000 | | 50 day SMA | 1000 | 1000 | 1000 | | 100 day SMA | 1000 | 1000 | 1000 | | 150 day SMA | 1000 | 1000 | 1000 | | 200 day SMA | 1000 | 1000 | 1000 |
|
|
