LincolnPharma LINCOLN full analysis,charts,indicators,moving averages,SMA,DMA,EMA,ADX,MACD,RSILincoln Pharma LINCOLN WideScreen charts, DMA,SMA,EMA technical analysis, forecast prediction, by indicators ADX,MACD,RSI,CCI NSE stock exchange
operates under Pharmaceuticals sector
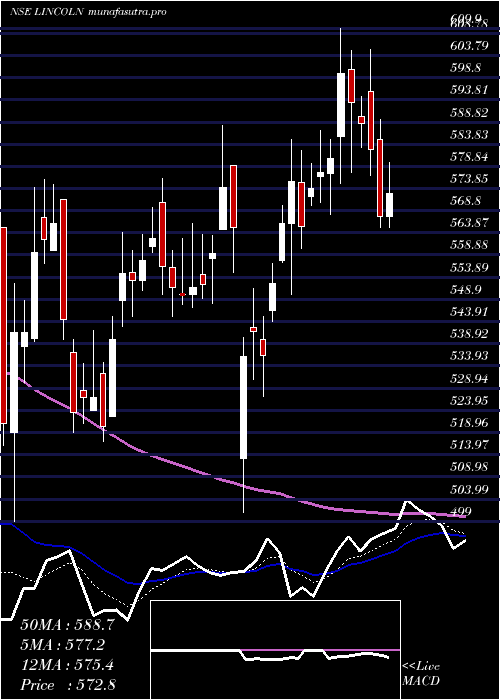
Daily price and charts and targets LincolnPharma Strong Daily Stock price targets for LincolnPharma LINCOLN are 525.88 and 532.98 | Daily Target 1 | 520.52 | | Daily Target 2 | 524.13 | | Daily Target 3 | 527.61666666667 | | Daily Target 4 | 531.23 | | Daily Target 5 | 534.72 |
Daily price and volume Lincoln Pharma
| Date |
Closing |
Open |
Range |
Volume |
Tue 28 October 2025 |
527.75 (0.24%) |
524.00 |
524.00 - 531.10 |
1.0726 times |
Mon 27 October 2025 |
526.50 (-0.16%) |
527.35 |
524.00 - 534.80 |
0.8247 times |
Fri 24 October 2025 |
527.35 (0.61%) |
527.00 |
523.00 - 536.45 |
1.4969 times |
Thu 23 October 2025 |
524.15 (-0.64%) |
528.50 |
520.75 - 531.80 |
0.6284 times |
Tue 21 October 2025 |
527.50 (0.78%) |
523.40 |
521.40 - 543.95 |
0.4192 times |
Mon 20 October 2025 |
523.40 (-0.2%) |
521.00 |
521.00 - 529.00 |
1.0521 times |
Fri 17 October 2025 |
524.45 (-0.1%) |
525.00 |
521.50 - 529.80 |
0.8213 times |
Thu 16 October 2025 |
525.00 (-0.45%) |
528.30 |
521.10 - 531.90 |
0.9097 times |
Wed 15 October 2025 |
527.35 (0.68%) |
523.80 |
518.00 - 531.00 |
1.6884 times |
Tue 14 October 2025 |
523.80 (-0.1%) |
525.00 |
518.00 - 527.25 |
1.0868 times |
Mon 13 October 2025 |
524.30 (-0.86%) |
522.60 |
522.00 - 527.95 |
0.5817 times |
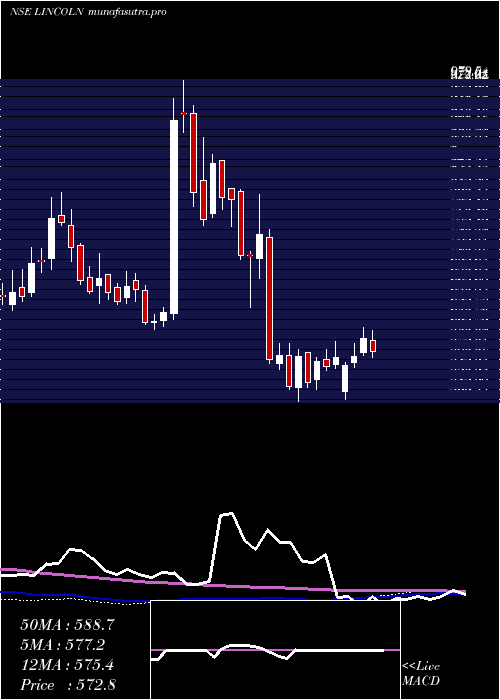
Weekly price and charts LincolnPharma Strong weekly Stock price targets for LincolnPharma LINCOLN are 525.88 and 536.68 | Weekly Target 1 | 518.05 | | Weekly Target 2 | 522.9 | | Weekly Target 3 | 528.85 | | Weekly Target 4 | 533.7 | | Weekly Target 5 | 539.65 |
Weekly price and volumes for Lincoln Pharma
| Date |
Closing |
Open |
Range |
Volume |
Tue 28 October 2025 |
527.75 (0.08%) |
527.35 |
524.00 - 534.80 |
0.3283 times |
Fri 24 October 2025 |
527.35 (0.55%) |
521.00 |
520.75 - 543.95 |
0.6223 times |
Fri 17 October 2025 |
524.45 (-0.83%) |
522.60 |
518.00 - 531.90 |
0.8803 times |
Fri 10 October 2025 |
528.85 (-0.69%) |
533.00 |
518.00 - 545.00 |
1.3503 times |
Fri 03 October 2025 |
532.55 (-0.88%) |
537.00 |
529.00 - 541.90 |
0.4723 times |
Fri 26 September 2025 |
537.30 (-3.19%) |
555.00 |
535.00 - 561.60 |
1.1279 times |
Fri 19 September 2025 |
555.00 (0.12%) |
554.35 |
551.25 - 562.45 |
1.0172 times |
Fri 12 September 2025 |
554.35 (-0.78%) |
552.00 |
549.95 - 565.75 |
1.4056 times |
Fri 05 September 2025 |
558.70 (3.72%) |
537.15 |
537.15 - 563.00 |
1.5318 times |
Fri 29 August 2025 |
538.65 (-2.16%) |
555.00 |
532.60 - 555.00 |
1.264 times |
Fri 22 August 2025 |
550.55 (1.46%) |
543.30 |
543.30 - 565.05 |
2.8022 times |
Monthly price and charts LincolnPharma Strong monthly Stock price targets for LincolnPharma LINCOLN are 509.38 and 536.38 | Monthly Target 1 | 503.25 | | Monthly Target 2 | 515.5 | | Monthly Target 3 | 530.25 | | Monthly Target 4 | 542.5 | | Monthly Target 5 | 557.25 |
Monthly price and volumes Lincoln Pharma
| Date |
Closing |
Open |
Range |
Volume |
Tue 28 October 2025 |
527.75 (-0.84%) |
531.00 |
518.00 - 545.00 |
0.1964 times |
Tue 30 September 2025 |
532.20 (-1.2%) |
537.15 |
529.00 - 565.75 |
0.3039 times |
Fri 29 August 2025 |
538.65 (0.97%) |
533.00 |
523.00 - 624.40 |
3.8222 times |
Thu 31 July 2025 |
533.45 (-5.71%) |
566.75 |
532.10 - 581.60 |
0.4434 times |
Mon 30 June 2025 |
565.75 (4.37%) |
541.70 |
541.30 - 609.30 |
0.7517 times |
Fri 30 May 2025 |
542.05 (-4.48%) |
567.50 |
538.25 - 629.00 |
0.8587 times |
Wed 30 April 2025 |
567.50 (2.9%) |
554.55 |
501.00 - 609.90 |
0.6397 times |
Fri 28 March 2025 |
551.50 (5.84%) |
519.05 |
499.00 - 576.20 |
0.7294 times |
Fri 28 February 2025 |
521.05 (-27.28%) |
713.00 |
516.00 - 808.80 |
1.5206 times |
Fri 31 January 2025 |
716.55 (-9.04%) |
791.80 |
640.00 - 869.00 |
0.7341 times |
Tue 31 December 2024 |
787.80 (24.79%) |
631.00 |
622.00 - 979.50 |
5.0502 times |
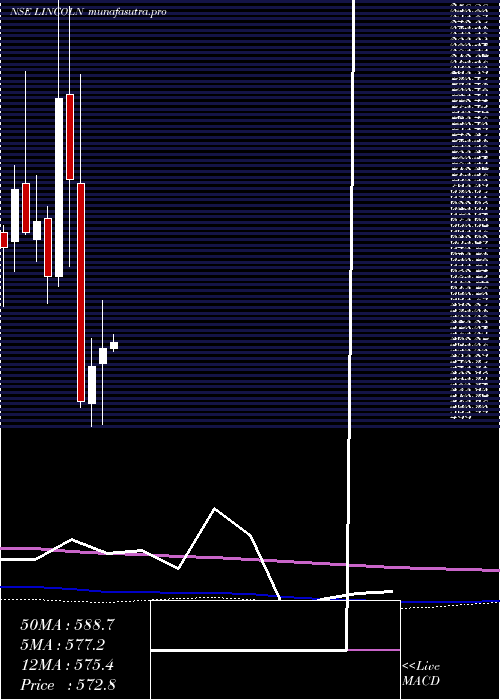
DMA SMA EMA moving averages of Lincoln Pharma LINCOLN
DMA (daily moving average) of Lincoln Pharma LINCOLN
| DMA period | DMA value | | 5 day DMA | 526.65 | | 12 day DMA | 525.87 | | 20 day DMA | 527.3 | | 35 day DMA | 537.84 | | 50 day DMA | 541.25 | | 100 day DMA | 550.48 | | 150 day DMA | 555.73 | | 200 day DMA | 581.18 | EMA (exponential moving average) of Lincoln Pharma LINCOLN
| EMA period | EMA current | EMA prev | EMA prev2 | | 5 day EMA | 526.64 | 526.09 | 525.89 | | 12 day EMA | 527.17 | 527.06 | 527.16 | | 20 day EMA | 529.76 | 529.97 | 530.33 | | 35 day EMA | 534.8 | 535.22 | 535.73 | | 50 day EMA | 541.35 | 541.9 | 542.53 |
SMA (simple moving average) of Lincoln Pharma LINCOLN
| SMA period | SMA current | SMA prev | SMA prev2 | | 5 day SMA | 526.65 | 525.78 | 525.37 | | 12 day SMA | 525.87 | 525.79 | 525.47 | | 20 day SMA | 527.3 | 527.78 | 528.65 | | 35 day SMA | 537.84 | 538.72 | 539.4 | | 50 day SMA | 541.25 | 541.59 | 541.99 | | 100 day SMA | 550.48 | 550.68 | 550.89 | | 150 day SMA | 555.73 | 555.91 | 556 | | 200 day SMA | 581.18 | 582.57 | 584.21 |
|
|
