Linc LINC full analysis,charts,indicators,moving averages,SMA,DMA,EMA,ADX,MACD,RSILinc LINC WideScreen charts, DMA,SMA,EMA technical analysis, forecast prediction, by indicators ADX,MACD,RSI,CCI NSE stock exchange
Daily price and charts and targets Linc Strong Daily Stock price targets for Linc LINC are 125.63 and 128.22 | Daily Target 1 | 123.83 | | Daily Target 2 | 124.84 | | Daily Target 3 | 126.42 | | Daily Target 4 | 127.43 | | Daily Target 5 | 129.01 |
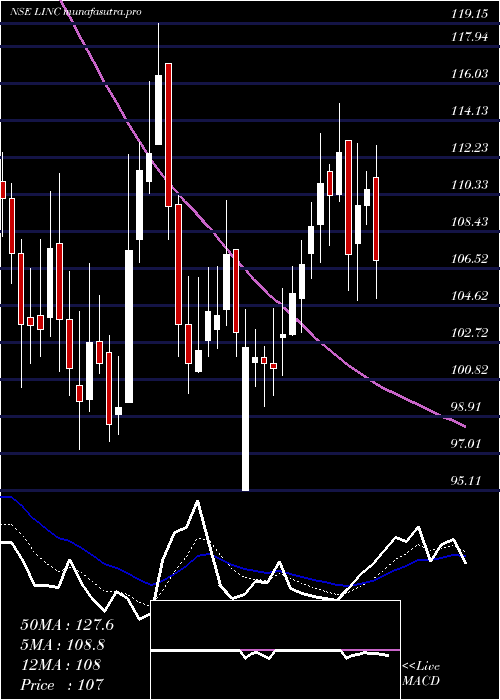
Daily price and volume Linc
| Date |
Closing |
Open |
Range |
Volume |
Tue 28 October 2025 |
125.85 (0.07%) |
125.76 |
125.41 - 128.00 |
0.3097 times |
Mon 27 October 2025 |
125.76 (-2.45%) |
129.00 |
125.00 - 129.00 |
0.691 times |
Fri 24 October 2025 |
128.92 (0.06%) |
129.28 |
126.61 - 130.99 |
0.3207 times |
Thu 23 October 2025 |
128.84 (-1.35%) |
131.73 |
127.00 - 133.38 |
1.2334 times |
Tue 21 October 2025 |
130.60 (2.88%) |
128.99 |
128.10 - 131.40 |
0.72 times |
Mon 20 October 2025 |
126.95 (5.53%) |
120.00 |
120.00 - 131.40 |
3.6856 times |
Fri 17 October 2025 |
120.30 (-1.38%) |
122.60 |
120.00 - 123.00 |
0.5164 times |
Thu 16 October 2025 |
121.98 (2.05%) |
118.40 |
118.40 - 123.50 |
0.3915 times |
Wed 15 October 2025 |
119.53 (-3.05%) |
123.90 |
119.00 - 123.90 |
1.6555 times |
Tue 14 October 2025 |
123.29 (-2.24%) |
126.00 |
122.53 - 126.79 |
0.4763 times |
Mon 13 October 2025 |
126.11 (1.29%) |
124.00 |
124.00 - 127.88 |
0.3097 times |
Weekly price and charts Linc Strong weekly Stock price targets for Linc LINC are 123.43 and 127.43 | Weekly Target 1 | 122.62 | | Weekly Target 2 | 124.23 | | Weekly Target 3 | 126.61666666667 | | Weekly Target 4 | 128.23 | | Weekly Target 5 | 130.62 |
Weekly price and volumes for Linc
| Date |
Closing |
Open |
Range |
Volume |
Tue 28 October 2025 |
125.85 (-2.38%) |
129.00 |
125.00 - 129.00 |
0.1558 times |
Fri 24 October 2025 |
128.92 (7.17%) |
120.00 |
120.00 - 133.38 |
0.9281 times |
Fri 17 October 2025 |
120.30 (-3.37%) |
124.00 |
118.40 - 127.88 |
0.5216 times |
Fri 10 October 2025 |
124.50 (-19.67%) |
130.50 |
124.00 - 130.55 |
0.4657 times |
Wed 02 July 2025 |
154.99 (6.19%) |
145.61 |
145.18 - 158.99 |
1.9187 times |
Fri 27 June 2025 |
145.95 (5.55%) |
138.27 |
135.59 - 147.99 |
1.2764 times |
Fri 20 June 2025 |
138.27 (-2.43%) |
140.40 |
124.50 - 143.38 |
1.261 times |
Fri 13 June 2025 |
141.72 (-3.28%) |
146.53 |
140.20 - 153.39 |
0.9401 times |
Fri 06 June 2025 |
146.53 (-3.65%) |
153.50 |
140.30 - 159.79 |
1.0292 times |
Fri 30 May 2025 |
152.08 (-0.22%) |
157.00 |
146.81 - 160.74 |
1.5033 times |
Fri 23 May 2025 |
152.41 (6.87%) |
142.60 |
136.96 - 156.00 |
2.2273 times |

Monthly price and charts Linc Strong monthly Stock price targets for Linc LINC are 114.64 and 129.62 | Monthly Target 1 | 110.9 | | Monthly Target 2 | 118.37 | | Monthly Target 3 | 125.87666666667 | | Monthly Target 4 | 133.35 | | Monthly Target 5 | 140.86 |
Monthly price and volumes Linc
| Date |
Closing |
Open |
Range |
Volume |
Tue 28 October 2025 |
125.85 (-18.8%) |
130.50 |
118.40 - 133.38 |
0.4301 times |
Wed 02 July 2025 |
154.99 (-0.07%) |
156.40 |
150.54 - 158.99 |
0.1751 times |
Mon 30 June 2025 |
155.10 (1.99%) |
153.50 |
124.50 - 159.79 |
1.1592 times |
Fri 30 May 2025 |
152.08 (42.2%) |
106.95 |
102.00 - 160.74 |
2.4879 times |
Wed 30 April 2025 |
106.95 (4.54%) |
102.80 |
95.11 - 115.00 |
0.5427 times |
Fri 28 March 2025 |
102.31 (-4.66%) |
107.31 |
97.23 - 119.15 |
1.3977 times |
Fri 28 February 2025 |
107.31 (-20.82%) |
138.50 |
105.75 - 140.80 |
0.4812 times |
Fri 31 January 2025 |
135.53 (-15.56%) |
159.98 |
124.40 - 168.00 |
0.9285 times |
Tue 31 December 2024 |
160.50 (-74.74%) |
635.30 |
153.00 - 794.35 |
2.2205 times |
Fri 29 November 2024 |
635.35 (-0.65%) |
648.75 |
596.00 - 661.00 |
0.177 times |
Thu 31 October 2024 |
639.50 (-8.88%) |
701.85 |
579.15 - 704.15 |
0.5579 times |

DMA SMA EMA moving averages of Linc LINC
DMA (daily moving average) of Linc LINC
| DMA period | DMA value | | 5 day DMA | 127.99 | | 12 day DMA | 125.22 | | 20 day DMA | 130.79 | | 35 day DMA | 135.24 | | 50 day DMA | 138.58 | | 100 day DMA | 123.54 | | 150 day DMA | 141.49 | | 200 day DMA | 266.08 | EMA (exponential moving average) of Linc LINC
| EMA period | EMA current | EMA prev | EMA prev2 | | 5 day EMA | 126.64 | 127.03 | 127.66 | | 12 day EMA | 127.5 | 127.8 | 128.17 | | 20 day EMA | 129.65 | 130.05 | 130.5 | | 35 day EMA | 132.95 | 133.37 | 133.82 | | 50 day EMA | 136.8 | 137.25 | 137.72 |
SMA (simple moving average) of Linc LINC
| SMA period | SMA current | SMA prev | SMA prev2 | | 5 day SMA | 127.99 | 128.21 | 127.12 | | 12 day SMA | 125.22 | 125.18 | 125.2 | | 20 day SMA | 130.79 | 131.78 | 132.78 | | 35 day SMA | 135.24 | 135.69 | 136.22 | | 50 day SMA | 138.58 | 138.93 | 139.31 | | 100 day SMA | 123.54 | 123.38 | 123.26 | | 150 day SMA | 141.49 | 145.7 | 149.47 | | 200 day SMA | 266.08 | 268.68 | 271.43 |
|
|
