LicnamcLicnmid100 LICNMID100 full analysis,charts,indicators,moving averages,SMA,DMA,EMA,ADX,MACD,RSILicnamc Licnmid100 LICNMID100 WideScreen charts, DMA,SMA,EMA technical analysis, forecast prediction, by indicators ADX,MACD,RSI,CCI NSE stock exchange
Daily price and charts and targets LicnamcLicnmid100 Strong Daily Stock price targets for LicnamcLicnmid100 LICNMID100 are 59.18 and 59.99 | Daily Target 1 | 58.55 | | Daily Target 2 | 59 | | Daily Target 3 | 59.356666666667 | | Daily Target 4 | 59.81 | | Daily Target 5 | 60.17 |
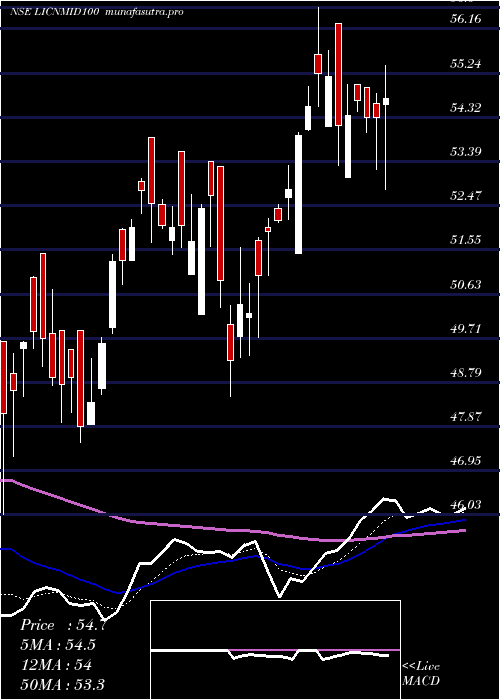
Daily price and volume Licnamc Licnmid100
| Date |
Closing |
Open |
Range |
Volume |
Tue 28 October 2025 |
59.46 (0.56%) |
58.90 |
58.90 - 59.71 |
0.2675 times |
Mon 27 October 2025 |
59.13 (-0.24%) |
59.57 |
59.06 - 59.91 |
0.4505 times |
Fri 24 October 2025 |
59.27 (0.46%) |
59.64 |
58.74 - 61.00 |
3.0619 times |
Thu 23 October 2025 |
59.00 (0.39%) |
58.88 |
58.82 - 59.62 |
0.4938 times |
Tue 21 October 2025 |
58.77 (-0.34%) |
58.73 |
58.70 - 59.78 |
0.3641 times |
Mon 20 October 2025 |
58.97 (0.48%) |
58.98 |
58.51 - 59.48 |
3.423 times |
Fri 17 October 2025 |
58.69 (-0.07%) |
59.19 |
58.47 - 59.19 |
0.4598 times |
Thu 16 October 2025 |
58.73 (-0.1%) |
58.79 |
58.56 - 59.04 |
0.425 times |
Wed 15 October 2025 |
58.79 (0.22%) |
58.67 |
58.46 - 58.95 |
0.5101 times |
Tue 14 October 2025 |
58.66 (0.84%) |
58.19 |
58.19 - 59.14 |
0.5444 times |
Mon 13 October 2025 |
58.17 (-0.38%) |
57.13 |
57.13 - 60.00 |
1.8607 times |
Weekly price and charts LicnamcLicnmid100 Strong weekly Stock price targets for LicnamcLicnmid100 LICNMID100 are 58.68 and 59.69 | Weekly Target 1 | 58.41 | | Weekly Target 2 | 58.94 | | Weekly Target 3 | 59.423333333333 | | Weekly Target 4 | 59.95 | | Weekly Target 5 | 60.43 |
Weekly price and volumes for Licnamc Licnmid100
| Date |
Closing |
Open |
Range |
Volume |
Tue 28 October 2025 |
59.46 (0.32%) |
59.57 |
58.90 - 59.91 |
0.104 times |
Fri 24 October 2025 |
59.27 (0.99%) |
58.98 |
58.51 - 61.00 |
1.0636 times |
Fri 17 October 2025 |
58.69 (0.51%) |
57.13 |
57.13 - 60.00 |
0.5504 times |
Fri 10 October 2025 |
58.39 (1.72%) |
57.68 |
57.11 - 58.80 |
0.2749 times |
Fri 03 October 2025 |
57.40 (0.88%) |
56.76 |
55.80 - 58.46 |
0.2839 times |
Fri 26 September 2025 |
56.90 (-3.59%) |
59.02 |
56.83 - 59.31 |
0.3065 times |
Fri 19 September 2025 |
59.02 (1.25%) |
60.04 |
57.95 - 60.04 |
0.3408 times |
Fri 12 September 2025 |
58.29 (0.14%) |
59.28 |
56.38 - 60.00 |
1.6402 times |
Fri 05 September 2025 |
58.21 (1.45%) |
57.87 |
56.31 - 67.50 |
5.1644 times |
Fri 29 August 2025 |
57.38 (-1.65%) |
56.88 |
56.39 - 59.70 |
0.2713 times |
Fri 22 August 2025 |
58.34 (2.05%) |
57.18 |
57.17 - 59.88 |
0.1851 times |

Monthly price and charts LicnamcLicnmid100 Strong monthly Stock price targets for LicnamcLicnmid100 LICNMID100 are 58.18 and 62.28 | Monthly Target 1 | 55.02 | | Monthly Target 2 | 57.24 | | Monthly Target 3 | 59.12 | | Monthly Target 4 | 61.34 | | Monthly Target 5 | 63.22 |
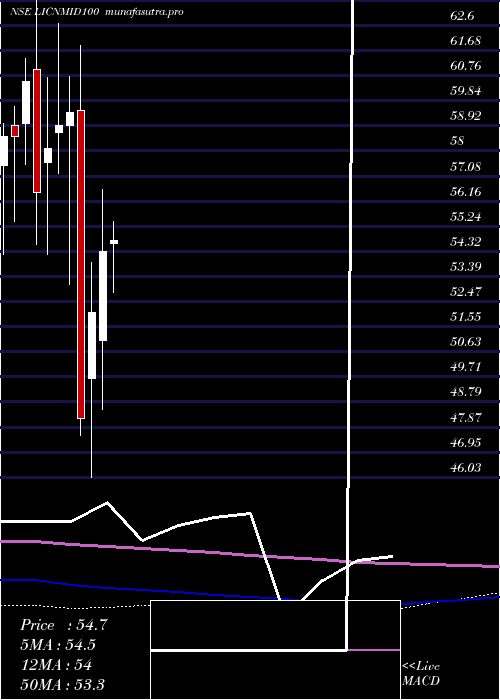
Monthly price and volumes Licnamc Licnmid100
| Date |
Closing |
Open |
Range |
Volume |
Tue 28 October 2025 |
59.46 (4.3%) |
57.80 |
56.90 - 61.00 |
0.9607 times |
Tue 30 September 2025 |
57.01 (-0.64%) |
57.87 |
55.80 - 67.50 |
3.555 times |
Fri 29 August 2025 |
57.38 (-0.59%) |
57.98 |
56.00 - 59.88 |
0.4924 times |
Thu 31 July 2025 |
57.72 (-3.22%) |
59.69 |
57.45 - 60.64 |
0.6515 times |
Mon 30 June 2025 |
59.64 (3.7%) |
57.89 |
56.73 - 60.64 |
1.0413 times |
Fri 30 May 2025 |
57.51 (5.87%) |
54.60 |
52.34 - 58.96 |
0.7218 times |
Wed 30 April 2025 |
54.32 (4.32%) |
51.03 |
48.50 - 56.60 |
0.5055 times |
Fri 28 March 2025 |
52.07 (8.05%) |
49.65 |
46.03 - 53.90 |
0.6049 times |
Fri 28 February 2025 |
48.19 (-18.87%) |
59.47 |
47.58 - 61.88 |
0.9734 times |
Fri 31 January 2025 |
59.40 (0.78%) |
58.94 |
53.11 - 60.72 |
0.4935 times |
Tue 31 December 2024 |
58.94 (1.46%) |
58.67 |
57.18 - 62.67 |
0.423 times |
DMA SMA EMA moving averages of Licnamc Licnmid100 LICNMID100
DMA (daily moving average) of Licnamc Licnmid100 LICNMID100
| DMA period | DMA value | | 5 day DMA | 59.13 | | 12 day DMA | 58.84 | | 20 day DMA | 58.34 | | 35 day DMA | 58.34 | | 50 day DMA | 58.38 | | 100 day DMA | 58.52 | | 150 day DMA | 57.12 | | 200 day DMA | 56.62 | EMA (exponential moving average) of Licnamc Licnmid100 LICNMID100
| EMA period | EMA current | EMA prev | EMA prev2 | | 5 day EMA | 59.17 | 59.03 | 58.98 | | 12 day EMA | 58.87 | 58.76 | 58.69 | | 20 day EMA | 58.64 | 58.55 | 58.49 | | 35 day EMA | 58.43 | 58.37 | 58.33 | | 50 day EMA | 58.32 | 58.27 | 58.23 |
SMA (simple moving average) of Licnamc Licnmid100 LICNMID100
| SMA period | SMA current | SMA prev | SMA prev2 | | 5 day SMA | 59.13 | 59.03 | 58.94 | | 12 day SMA | 58.84 | 58.72 | 58.62 | | 20 day SMA | 58.34 | 58.22 | 58.16 | | 35 day SMA | 58.34 | 58.3 | 58.29 | | 50 day SMA | 58.38 | 58.33 | 58.27 | | 100 day SMA | 58.52 | 58.5 | 58.48 | | 150 day SMA | 57.12 | 57.07 | 57 | | 200 day SMA | 56.62 | 56.62 | 56.61 |
|
|
