LicMf LICMFGOLD full analysis,charts,indicators,moving averages,SMA,DMA,EMA,ADX,MACD,RSILic Mf LICMFGOLD WideScreen charts, DMA,SMA,EMA technical analysis, forecast prediction, by indicators ADX,MACD,RSI,CCI NSE stock exchange
Daily price and charts and targets LicMf Strong Daily Stock price targets for LicMf LICMFGOLD are 10050.53 and 10569.78 | Daily Target 1 | 9943.95 | | Daily Target 2 | 10157.1 | | Daily Target 3 | 10463.2 | | Daily Target 4 | 10676.35 | | Daily Target 5 | 10982.45 |
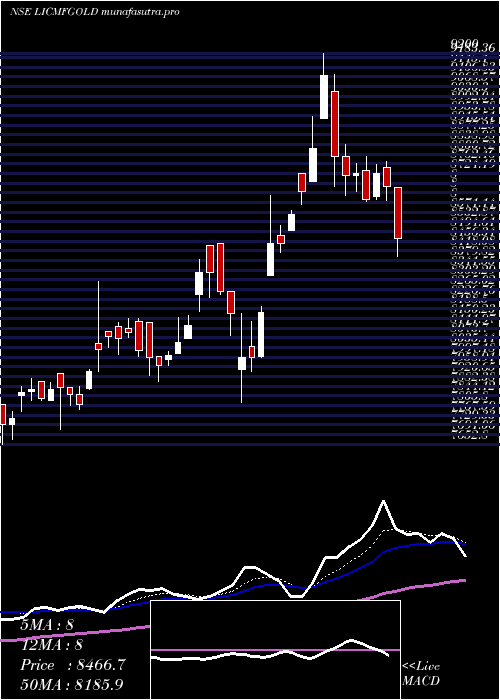
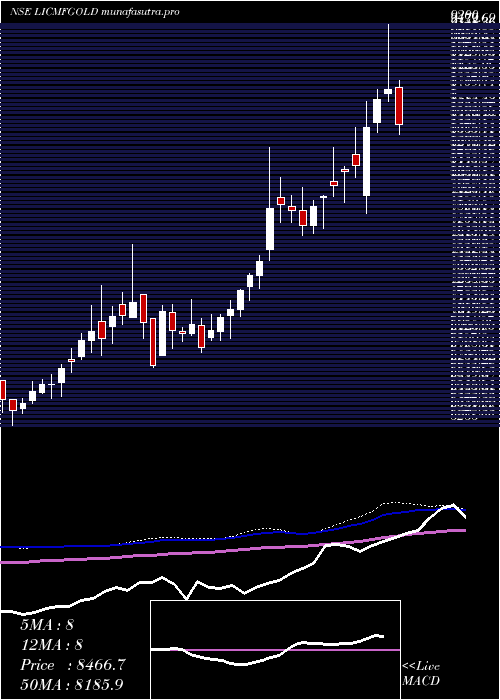
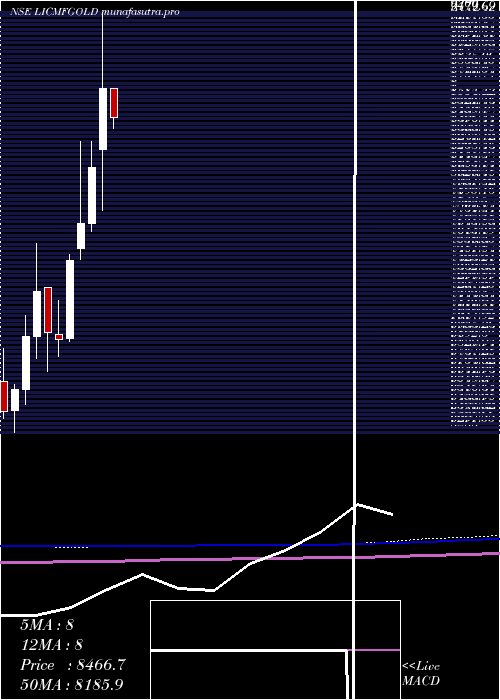
Daily price and volume Lic Mf
| Date |
Closing |
Open |
Range |
Volume |
Tue 28 October 2025 |
10370.25 (-4.19%) |
10767.95 |
10250.05 - 10769.30 |
0.6156 times |
Mon 27 October 2025 |
10823.40 (-0.57%) |
10974.60 |
10716.60 - 11005.30 |
0.3192 times |
Fri 24 October 2025 |
10885.90 (-0.51%) |
10826.65 |
10826.60 - 11163.00 |
0.2969 times |
Thu 23 October 2025 |
10941.85 (-4.72%) |
11770.35 |
10304.55 - 11770.35 |
2.4397 times |
Tue 21 October 2025 |
11483.30 (0.18%) |
11500.00 |
11300.00 - 11575.00 |
0.132 times |
Mon 20 October 2025 |
11462.55 (-3.92%) |
11877.70 |
11360.00 - 11879.90 |
0.6395 times |
Fri 17 October 2025 |
11930.40 (3.63%) |
11633.10 |
11633.10 - 12100.00 |
1.3434 times |
Thu 16 October 2025 |
11512.50 (-0.68%) |
11591.10 |
11451.00 - 11750.00 |
1.1003 times |
Wed 15 October 2025 |
11590.80 (1.07%) |
11525.60 |
11477.55 - 11699.95 |
1.2425 times |
Tue 14 October 2025 |
11468.25 (2.13%) |
11303.00 |
11303.00 - 11633.95 |
1.8708 times |
Mon 13 October 2025 |
11228.95 (2.95%) |
11173.90 |
11003.45 - 11250.05 |
0.9051 times |
Weekly price and charts LicMf Strong weekly Stock price targets for LicMf LICMFGOLD are 9932.53 and 10687.78 | Weekly Target 1 | 9786.62 | | Weekly Target 2 | 10078.43 | | Weekly Target 3 | 10541.866666667 | | Weekly Target 4 | 10833.68 | | Weekly Target 5 | 11297.12 |
Weekly price and volumes for Lic Mf
| Date |
Closing |
Open |
Range |
Volume |
Tue 28 October 2025 |
10370.25 (-4.74%) |
10974.60 |
10250.05 - 11005.30 |
0.2112 times |
Fri 24 October 2025 |
10885.90 (-8.75%) |
11877.70 |
10304.55 - 11879.90 |
0.7925 times |
Fri 17 October 2025 |
11930.40 (9.38%) |
11173.90 |
11003.45 - 12100.00 |
1.4598 times |
Fri 10 October 2025 |
10907.65 (1.77%) |
10937.95 |
10771.85 - 11191.00 |
1.365 times |
Fri 03 October 2025 |
10718.30 (5.14%) |
10347.65 |
10250.00 - 11350.00 |
1.3639 times |
Fri 26 September 2025 |
10194.20 (2.54%) |
10065.00 |
9985.00 - 10499.50 |
1.0663 times |
Fri 19 September 2025 |
9941.55 (0.05%) |
9974.95 |
9800.00 - 10179.75 |
1.1259 times |
Fri 12 September 2025 |
9936.20 (2.37%) |
9778.05 |
9750.00 - 11477.00 |
1.6294 times |
Fri 05 September 2025 |
9706.50 (4.51%) |
9318.00 |
9318.00 - 9871.90 |
0.6286 times |
Fri 29 August 2025 |
9287.75 (3.01%) |
9149.85 |
9052.20 - 9315.00 |
0.3574 times |
Fri 22 August 2025 |
9016.20 (-0.46%) |
9103.00 |
8907.15 - 9105.75 |
0.4224 times |
Monthly price and charts LicMf Strong monthly Stock price targets for LicMf LICMFGOLD are 9385.18 and 11235.13 | Monthly Target 1 | 9056.82 | | Monthly Target 2 | 9713.53 | | Monthly Target 3 | 10906.766666667 | | Monthly Target 4 | 11563.48 | | Monthly Target 5 | 12756.72 |
Monthly price and volumes Lic Mf
| Date |
Closing |
Open |
Range |
Volume |
Tue 28 October 2025 |
10370.25 (-0.62%) |
10639.70 |
10250.05 - 12100.00 |
2.2126 times |
Tue 30 September 2025 |
10435.20 (12.35%) |
9318.00 |
9318.00 - 11477.00 |
2.2606 times |
Fri 29 August 2025 |
9287.75 (4.01%) |
8929.60 |
8880.15 - 9315.00 |
0.8421 times |
Thu 31 July 2025 |
8929.55 (2.29%) |
8947.45 |
8720.00 - 9107.00 |
0.8126 times |
Mon 30 June 2025 |
8729.25 (1.02%) |
8690.05 |
8645.70 - 9193.00 |
0.6472 times |
Fri 30 May 2025 |
8640.70 (-0.36%) |
8669.95 |
8325.00 - 9038.85 |
0.8157 times |
Wed 30 April 2025 |
8671.90 (6.76%) |
8244.95 |
7816.00 - 9200.00 |
0.6286 times |
Fri 28 March 2025 |
8122.45 (5.07%) |
7730.65 |
7669.80 - 8297.70 |
0.3128 times |
Fri 28 February 2025 |
7730.60 (3.55%) |
7549.90 |
7475.05 - 8298.00 |
1.3004 times |
Fri 31 January 2025 |
7465.50 (7.96%) |
6920.00 |
6902.20 - 7509.90 |
0.1674 times |
Tue 31 December 2024 |
6915.25 (-0.67%) |
6950.00 |
6799.95 - 7189.95 |
0.1358 times |
DMA SMA EMA moving averages of Lic Mf LICMFGOLD
DMA (daily moving average) of Lic Mf LICMFGOLD
| DMA period | DMA value | | 5 day DMA | 10900.94 | | 12 day DMA | 11217.15 | | 20 day DMA | 11053.15 | | 35 day DMA | 10649.87 | | 50 day DMA | 10228.96 | | 100 day DMA | 9576.66 | | 150 day DMA | 9221.93 | | 200 day DMA | 8820.92 | EMA (exponential moving average) of Lic Mf LICMFGOLD
| EMA period | EMA current | EMA prev | EMA prev2 | | 5 day EMA | 10829.89 | 11059.67 | 11177.79 | | 12 day EMA | 11008.91 | 11124.99 | 11179.81 | | 20 day EMA | 10921.54 | 10979.55 | 10995.98 | | 35 day EMA | 10607.04 | 10620.98 | 10609.06 | | 50 day EMA | 10199.56 | 10192.6 | 10166.86 |
SMA (simple moving average) of Lic Mf LICMFGOLD
| SMA period | SMA current | SMA prev | SMA prev2 | | 5 day SMA | 10900.94 | 11119.4 | 11340.8 | | 12 day SMA | 11217.15 | 11279.43 | 11303.21 | | 20 day SMA | 11053.15 | 11044.35 | 11016.14 | | 35 day SMA | 10649.87 | 10630.9 | 10597.1 | | 50 day SMA | 10228.96 | 10202.86 | 10167.24 | | 100 day SMA | 9576.66 | 9561.27 | 9541.12 | | 150 day SMA | 9221.93 | 9206.6 | 9188.3 | | 200 day SMA | 8820.92 | 8803.99 | 8785.15 |
|
|
