LakshmiFinance LFIC full analysis,charts,indicators,moving averages,SMA,DMA,EMA,ADX,MACD,RSILakshmi Finance LFIC WideScreen charts, DMA,SMA,EMA technical analysis, forecast prediction, by indicators ADX,MACD,RSI,CCI NSE stock exchange
Daily price and charts and targets LakshmiFinance Strong Daily Stock price targets for LakshmiFinance LFIC are 208.81 and 233.65 | Daily Target 1 | 189.32 | | Daily Target 2 | 203.46 | | Daily Target 3 | 214.15666666667 | | Daily Target 4 | 228.3 | | Daily Target 5 | 239 |
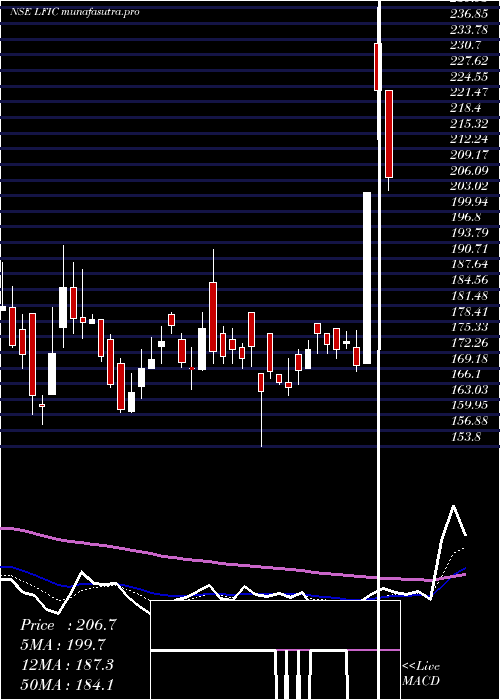
Daily price and volume Lakshmi Finance
| Date |
Closing |
Open |
Range |
Volume |
Wed 29 October 2025 |
217.61 (6.83%) |
203.69 |
200.01 - 224.85 |
5.7829 times |
Tue 28 October 2025 |
203.70 (0%) |
203.69 |
202.25 - 205.99 |
0.9817 times |
Mon 27 October 2025 |
203.69 (0.59%) |
203.00 |
203.00 - 207.80 |
0.5725 times |
Fri 24 October 2025 |
202.49 (-1.14%) |
203.52 |
202.06 - 204.98 |
0.3189 times |
Thu 23 October 2025 |
204.82 (-0.48%) |
202.06 |
202.06 - 210.97 |
0.5706 times |
Tue 21 October 2025 |
205.80 (1.79%) |
202.20 |
202.20 - 207.64 |
0.1701 times |
Mon 20 October 2025 |
202.19 (0.33%) |
200.00 |
200.00 - 208.00 |
0.2872 times |
Fri 17 October 2025 |
201.52 (-0.15%) |
213.95 |
201.01 - 213.95 |
0.2494 times |
Thu 16 October 2025 |
201.82 (0.37%) |
201.25 |
201.10 - 203.99 |
0.31 times |
Wed 15 October 2025 |
201.08 (-1.06%) |
201.01 |
198.54 - 204.00 |
0.7564 times |
Tue 14 October 2025 |
203.24 (-2.2%) |
212.40 |
198.30 - 212.40 |
0.961 times |
Weekly price and charts LakshmiFinance Strong weekly Stock price targets for LakshmiFinance LFIC are 208.81 and 233.65 | Weekly Target 1 | 189.32 | | Weekly Target 2 | 203.46 | | Weekly Target 3 | 214.15666666667 | | Weekly Target 4 | 228.3 | | Weekly Target 5 | 239 |
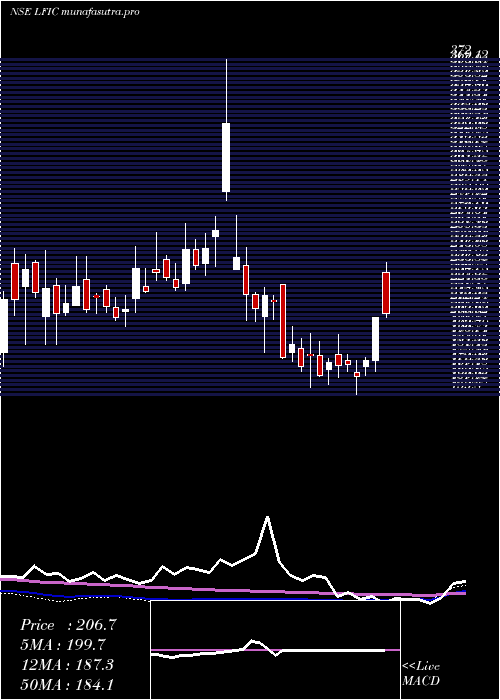
Weekly price and volumes for Lakshmi Finance
| Date |
Closing |
Open |
Range |
Volume |
Wed 29 October 2025 |
217.61 (7.47%) |
203.00 |
200.01 - 224.85 |
0.8022 times |
Fri 24 October 2025 |
202.49 (0.48%) |
200.00 |
200.00 - 210.97 |
0.1473 times |
Fri 17 October 2025 |
201.52 (-2.37%) |
208.90 |
198.30 - 213.95 |
0.2534 times |
Fri 10 October 2025 |
206.42 (-1.48%) |
206.00 |
204.20 - 212.96 |
0.3148 times |
Fri 03 October 2025 |
209.53 (1.44%) |
215.89 |
202.55 - 224.85 |
1.3653 times |
Fri 26 September 2025 |
206.55 (-4.65%) |
214.00 |
206.03 - 218.00 |
0.2231 times |
Fri 19 September 2025 |
216.63 (2.72%) |
210.11 |
208.31 - 219.00 |
0.1702 times |
Fri 12 September 2025 |
210.90 (0.52%) |
208.81 |
208.01 - 225.99 |
0.4459 times |
Fri 05 September 2025 |
209.81 (4.01%) |
201.58 |
200.01 - 240.90 |
6.1925 times |
Fri 29 August 2025 |
201.72 (-2.35%) |
208.51 |
200.98 - 210.00 |
0.0854 times |
Fri 22 August 2025 |
206.57 (2.31%) |
205.74 |
205.19 - 218.00 |
0.2724 times |
Monthly price and charts LakshmiFinance Strong monthly Stock price targets for LakshmiFinance LFIC are 207.96 and 234.51 | Monthly Target 1 | 187.04 | | Monthly Target 2 | 202.32 | | Monthly Target 3 | 213.58666666667 | | Monthly Target 4 | 228.87 | | Monthly Target 5 | 240.14 |
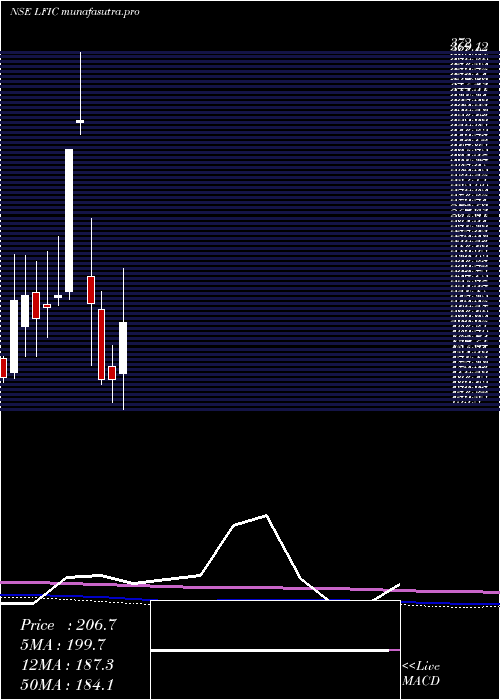
Monthly price and volumes Lakshmi Finance
| Date |
Closing |
Open |
Range |
Volume |
Wed 29 October 2025 |
217.61 (5.16%) |
210.80 |
198.30 - 224.85 |
0.5307 times |
Tue 30 September 2025 |
206.93 (2.58%) |
201.58 |
200.01 - 240.90 |
1.3851 times |
Fri 29 August 2025 |
201.72 (-5.97%) |
211.10 |
200.98 - 218.74 |
0.1662 times |
Thu 31 July 2025 |
214.53 (-1.68%) |
218.20 |
204.00 - 240.00 |
0.8864 times |
Mon 30 June 2025 |
218.20 (-1.5%) |
221.72 |
205.37 - 250.50 |
1.0434 times |
Fri 30 May 2025 |
221.52 (9.24%) |
203.87 |
182.50 - 239.31 |
1.7864 times |
Wed 30 April 2025 |
202.78 (17.6%) |
175.96 |
153.80 - 239.95 |
2.6565 times |
Fri 28 March 2025 |
172.43 (0.35%) |
179.95 |
158.00 - 193.18 |
0.6339 times |
Fri 28 February 2025 |
171.83 (-21.29%) |
215.00 |
169.00 - 225.70 |
0.2457 times |
Fri 31 January 2025 |
218.32 (-33.94%) |
235.00 |
180.82 - 270.17 |
0.6658 times |
Fri 04 October 2024 |
330.50 (5.75%) |
329.00 |
321.80 - 372.00 |
4.8827 times |
DMA SMA EMA moving averages of Lakshmi Finance LFIC
DMA (daily moving average) of Lakshmi Finance LFIC
| DMA period | DMA value | | 5 day DMA | 206.46 | | 12 day DMA | 204.65 | | 20 day DMA | 205.61 | | 35 day DMA | 208.24 | | 50 day DMA | 208.19 | | 100 day DMA | 211.05 | | 150 day DMA | 205.38 | | 200 day DMA | 202.64 | EMA (exponential moving average) of Lakshmi Finance LFIC
| EMA period | EMA current | EMA prev | EMA prev2 | | 5 day EMA | 208.28 | 203.62 | 203.58 | | 12 day EMA | 206.25 | 204.19 | 204.28 | | 20 day EMA | 206.35 | 205.17 | 205.33 | | 35 day EMA | 206.78 | 206.14 | 206.28 | | 50 day EMA | 207.88 | 207.48 | 207.63 |
SMA (simple moving average) of Lakshmi Finance LFIC
| SMA period | SMA current | SMA prev | SMA prev2 | | 5 day SMA | 206.46 | 204.1 | 203.8 | | 12 day SMA | 204.65 | 203.72 | 203.87 | | 20 day SMA | 205.61 | 205.01 | 205.15 | | 35 day SMA | 208.24 | 207.97 | 208.15 | | 50 day SMA | 208.19 | 207.88 | 207.93 | | 100 day SMA | 211.05 | 211.02 | 211.14 | | 150 day SMA | 205.38 | 205.07 | 204.84 | | 200 day SMA | 202.64 | 202.79 | 203 |
|
|
