LatentView LATENTVIEW full analysis,charts,indicators,moving averages,SMA,DMA,EMA,ADX,MACD,RSILatent View LATENTVIEW WideScreen charts, DMA,SMA,EMA technical analysis, forecast prediction, by indicators ADX,MACD,RSI,CCI NSE stock exchange
Daily price and charts and targets LatentView Strong Daily Stock price targets for LatentView LATENTVIEW are 415.15 and 426.7 | Daily Target 1 | 406.05 | | Daily Target 2 | 412.7 | | Daily Target 3 | 417.6 | | Daily Target 4 | 424.25 | | Daily Target 5 | 429.15 |
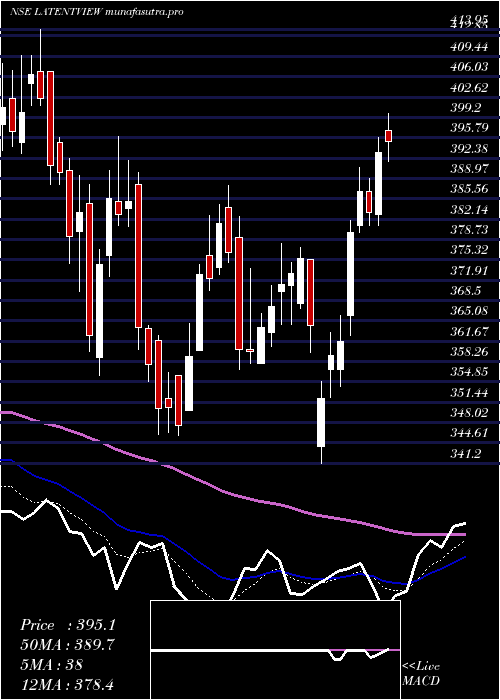
Daily price and volume Latent View
| Date |
Closing |
Open |
Range |
Volume |
Wed 29 October 2025 |
419.35 (0.98%) |
413.50 |
410.95 - 422.50 |
0.7158 times |
Tue 28 October 2025 |
415.30 (-2.34%) |
427.10 |
414.10 - 428.80 |
0.9558 times |
Mon 27 October 2025 |
425.25 (-0.78%) |
430.00 |
412.25 - 432.85 |
2.564 times |
Fri 24 October 2025 |
428.60 (-1.13%) |
433.50 |
425.80 - 438.00 |
1.0186 times |
Thu 23 October 2025 |
433.50 (0.25%) |
435.60 |
428.50 - 441.00 |
1.6508 times |
Tue 21 October 2025 |
432.40 (0.57%) |
430.00 |
428.50 - 435.00 |
0.2085 times |
Mon 20 October 2025 |
429.95 (0.47%) |
428.70 |
425.65 - 434.10 |
0.6008 times |
Fri 17 October 2025 |
427.95 (-1.79%) |
432.45 |
424.50 - 441.70 |
0.6997 times |
Thu 16 October 2025 |
435.75 (1.47%) |
429.45 |
429.45 - 439.35 |
0.7169 times |
Wed 15 October 2025 |
429.45 (-0.06%) |
429.80 |
425.00 - 437.50 |
0.869 times |
Tue 14 October 2025 |
429.70 (-0.98%) |
433.00 |
427.35 - 442.00 |
0.6572 times |
Weekly price and charts LatentView Strong weekly Stock price targets for LatentView LATENTVIEW are 404.2 and 426.1 | Weekly Target 1 | 399.15 | | Weekly Target 2 | 409.25 | | Weekly Target 3 | 421.05 | | Weekly Target 4 | 431.15 | | Weekly Target 5 | 442.95 |
Weekly price and volumes for Latent View
| Date |
Closing |
Open |
Range |
Volume |
Wed 29 October 2025 |
419.35 (-2.16%) |
430.00 |
410.95 - 432.85 |
1.1012 times |
Fri 24 October 2025 |
428.60 (0.15%) |
428.70 |
425.65 - 441.00 |
0.9044 times |
Fri 17 October 2025 |
427.95 (-2.68%) |
439.00 |
424.50 - 442.00 |
0.9689 times |
Fri 10 October 2025 |
439.75 (5.79%) |
415.70 |
413.30 - 444.00 |
1.5469 times |
Fri 03 October 2025 |
415.70 (2.43%) |
403.00 |
398.50 - 417.55 |
0.608 times |
Fri 26 September 2025 |
405.85 (-4.42%) |
422.95 |
400.20 - 422.95 |
0.8118 times |
Fri 19 September 2025 |
424.60 (1.8%) |
417.05 |
414.15 - 430.15 |
0.9219 times |
Fri 12 September 2025 |
417.10 (-2.79%) |
427.00 |
416.20 - 433.95 |
0.5713 times |
Fri 05 September 2025 |
429.05 (3.27%) |
414.00 |
410.15 - 434.20 |
0.7704 times |
Fri 29 August 2025 |
415.45 (-1.06%) |
420.00 |
412.45 - 444.00 |
1.7953 times |
Fri 22 August 2025 |
419.90 (5.29%) |
403.35 |
397.50 - 437.85 |
2.1946 times |

Monthly price and charts LatentView Strong monthly Stock price targets for LatentView LATENTVIEW are 412.78 and 450.58 | Monthly Target 1 | 385.38 | | Monthly Target 2 | 402.37 | | Monthly Target 3 | 423.18333333333 | | Monthly Target 4 | 440.17 | | Monthly Target 5 | 460.98 |
Monthly price and volumes Latent View
| Date |
Closing |
Open |
Range |
Volume |
Wed 29 October 2025 |
419.35 (2.67%) |
411.70 |
406.20 - 444.00 |
0.684 times |
Tue 30 September 2025 |
408.45 (-1.68%) |
414.00 |
398.50 - 434.20 |
0.5064 times |
Fri 29 August 2025 |
415.45 (1.33%) |
412.90 |
386.40 - 444.00 |
0.7374 times |
Thu 31 July 2025 |
410.00 (-0.36%) |
410.00 |
403.10 - 467.00 |
2.136 times |
Mon 30 June 2025 |
411.50 (-1.09%) |
412.20 |
390.10 - 430.80 |
1.231 times |
Fri 30 May 2025 |
416.05 (5.8%) |
395.75 |
382.25 - 433.70 |
0.9657 times |
Wed 30 April 2025 |
393.25 (6.99%) |
370.00 |
341.20 - 431.40 |
1.3267 times |
Fri 28 March 2025 |
367.55 (-4.1%) |
384.75 |
345.90 - 395.95 |
0.9947 times |
Fri 28 February 2025 |
383.25 (-12.53%) |
438.35 |
370.05 - 466.00 |
0.6558 times |
Fri 31 January 2025 |
438.15 (-10.49%) |
491.00 |
401.70 - 509.95 |
0.7622 times |
Tue 31 December 2024 |
489.50 (9.29%) |
447.55 |
443.65 - 520.25 |
1.4498 times |

DMA SMA EMA moving averages of Latent View LATENTVIEW
DMA (daily moving average) of Latent View LATENTVIEW
| DMA period | DMA value | | 5 day DMA | 424.4 | | 12 day DMA | 428.43 | | 20 day DMA | 425.81 | | 35 day DMA | 421.47 | | 50 day DMA | 421.09 | | 100 day DMA | 418.9 | | 150 day DMA | 411.75 | | 200 day DMA | 412.23 | EMA (exponential moving average) of Latent View LATENTVIEW
| EMA period | EMA current | EMA prev | EMA prev2 | | 5 day EMA | 422.71 | 424.39 | 428.93 | | 12 day EMA | 425.31 | 426.39 | 428.41 | | 20 day EMA | 424.57 | 425.12 | 426.15 | | 35 day EMA | 422.66 | 422.86 | 423.31 | | 50 day EMA | 419.29 | 419.29 | 419.45 |
SMA (simple moving average) of Latent View LATENTVIEW
| SMA period | SMA current | SMA prev | SMA prev2 | | 5 day SMA | 424.4 | 427.01 | 429.94 | | 12 day SMA | 428.43 | 430.13 | 431.12 | | 20 day SMA | 425.81 | 424.94 | 424.47 | | 35 day SMA | 421.47 | 421.72 | 422.12 | | 50 day SMA | 421.09 | 420.68 | 420.37 | | 100 day SMA | 418.9 | 418.8 | 418.75 | | 150 day SMA | 411.75 | 411.44 | 411.15 | | 200 day SMA | 412.23 | 412.58 | 412.92 |
|
|
