Ksb KSB full analysis,charts,indicators,moving averages,SMA,DMA,EMA,ADX,MACD,RSIKsb KSB WideScreen charts, DMA,SMA,EMA technical analysis, forecast prediction, by indicators ADX,MACD,RSI,CCI NSE stock exchange
Daily price and charts and targets Ksb Strong Daily Stock price targets for Ksb KSB are 772.73 and 802.53 | Daily Target 1 | 765.72 | | Daily Target 2 | 779.73 | | Daily Target 3 | 795.51666666667 | | Daily Target 4 | 809.53 | | Daily Target 5 | 825.32 |
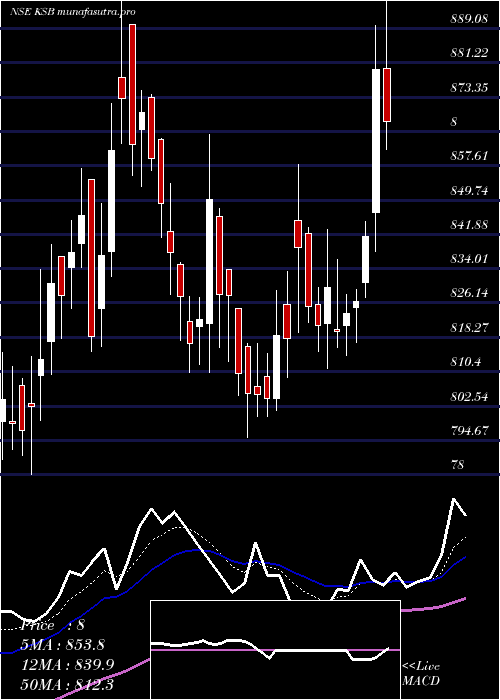
Daily price and volume Ksb
| Date |
Closing |
Open |
Range |
Volume |
Tue 28 October 2025 |
793.75 (-0.74%) |
799.65 |
781.50 - 811.30 |
3.6347 times |
Mon 27 October 2025 |
799.65 (-0.41%) |
802.00 |
793.55 - 807.20 |
0.7225 times |
Fri 24 October 2025 |
802.95 (-0.6%) |
807.80 |
799.20 - 812.05 |
0.5801 times |
Thu 23 October 2025 |
807.80 (-0.2%) |
810.00 |
804.10 - 814.50 |
0.3893 times |
Tue 21 October 2025 |
809.45 (0%) |
798.05 |
798.05 - 816.15 |
0.1602 times |
Mon 20 October 2025 |
809.45 (0.28%) |
810.85 |
780.00 - 814.90 |
1.438 times |
Fri 17 October 2025 |
807.20 (1.28%) |
801.50 |
789.10 - 809.00 |
1.0562 times |
Thu 16 October 2025 |
797.00 (-1.01%) |
806.75 |
794.00 - 809.40 |
0.576 times |
Wed 15 October 2025 |
805.15 (0.53%) |
804.00 |
796.50 - 815.00 |
0.4904 times |
Tue 14 October 2025 |
800.90 (0.16%) |
796.50 |
793.00 - 805.95 |
0.9527 times |
Mon 13 October 2025 |
799.65 (-0.44%) |
796.50 |
789.70 - 802.45 |
0.4974 times |
Weekly price and charts Ksb Strong weekly Stock price targets for Ksb KSB are 772.73 and 802.53 | Weekly Target 1 | 765.72 | | Weekly Target 2 | 779.73 | | Weekly Target 3 | 795.51666666667 | | Weekly Target 4 | 809.53 | | Weekly Target 5 | 825.32 |
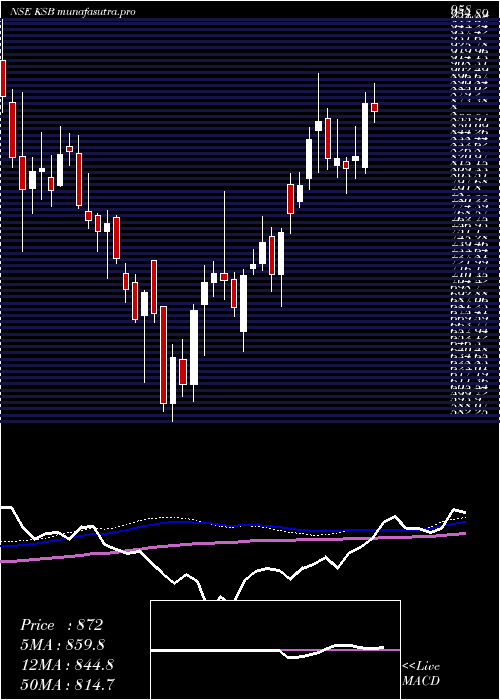
Weekly price and volumes for Ksb
| Date |
Closing |
Open |
Range |
Volume |
Tue 28 October 2025 |
793.75 (-1.15%) |
802.00 |
781.50 - 811.30 |
0.2606 times |
Fri 24 October 2025 |
802.95 (-0.53%) |
810.85 |
780.00 - 816.15 |
0.1535 times |
Fri 17 October 2025 |
807.20 (0.5%) |
796.50 |
789.10 - 815.00 |
0.2137 times |
Fri 10 October 2025 |
803.15 (-1.31%) |
805.00 |
795.00 - 814.55 |
0.186 times |
Fri 03 October 2025 |
813.85 (-0.71%) |
821.15 |
785.15 - 837.60 |
0.6787 times |
Fri 26 September 2025 |
819.65 (-5.18%) |
860.00 |
816.10 - 867.30 |
0.2437 times |
Fri 19 September 2025 |
864.45 (4.22%) |
836.90 |
833.55 - 875.00 |
0.4431 times |
Fri 12 September 2025 |
829.45 (1.02%) |
822.00 |
804.05 - 833.80 |
0.216 times |
Fri 05 September 2025 |
821.05 (-0.59%) |
825.90 |
805.00 - 852.95 |
0.4436 times |
Fri 29 August 2025 |
825.90 (1.95%) |
814.40 |
790.25 - 912.00 |
7.1613 times |
Fri 22 August 2025 |
810.10 (1.19%) |
805.00 |
791.00 - 828.00 |
0.2604 times |
Monthly price and charts Ksb Strong monthly Stock price targets for Ksb KSB are 762.65 and 811.1 | Monthly Target 1 | 752.28 | | Monthly Target 2 | 773.02 | | Monthly Target 3 | 800.73333333333 | | Monthly Target 4 | 821.47 | | Monthly Target 5 | 849.18 |
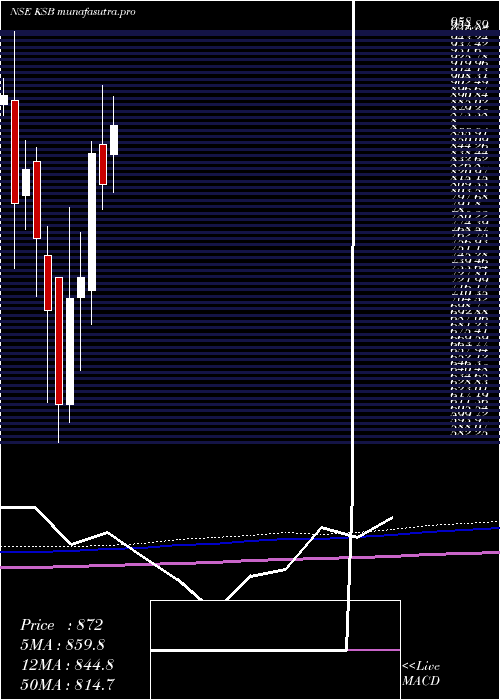
Monthly price and volumes Ksb
| Date |
Closing |
Open |
Range |
Volume |
Tue 28 October 2025 |
793.75 (-3.39%) |
821.60 |
780.00 - 828.45 |
0.2385 times |
Tue 30 September 2025 |
821.60 (-0.52%) |
825.90 |
785.15 - 875.00 |
0.5281 times |
Fri 29 August 2025 |
825.90 (-1.51%) |
835.00 |
766.80 - 912.00 |
2.1279 times |
Thu 31 July 2025 |
838.60 (2.51%) |
845.00 |
811.10 - 900.00 |
0.6892 times |
Mon 30 June 2025 |
818.05 (-3.33%) |
854.60 |
795.20 - 908.00 |
0.3989 times |
Fri 30 May 2025 |
846.20 (15.5%) |
721.00 |
690.00 - 856.90 |
0.4108 times |
Wed 30 April 2025 |
732.65 (2.64%) |
715.00 |
647.80 - 773.70 |
0.5954 times |
Fri 28 March 2025 |
713.80 (15.69%) |
617.00 |
600.75 - 796.95 |
2.0275 times |
Fri 28 February 2025 |
617.00 (-12.18%) |
733.00 |
582.25 - 733.00 |
2.4999 times |
Fri 31 January 2025 |
702.55 (-8.56%) |
753.00 |
618.50 - 779.15 |
0.4838 times |
Tue 31 December 2024 |
768.30 (-7.66%) |
839.25 |
715.50 - 852.00 |
0.6256 times |
DMA SMA EMA moving averages of Ksb KSB
DMA (daily moving average) of Ksb KSB
| DMA period | DMA value | | 5 day DMA | 802.72 | | 12 day DMA | 803.01 | | 20 day DMA | 805.17 | | 35 day DMA | 819.78 | | 50 day DMA | 818.88 | | 100 day DMA | 829.34 | | 150 day DMA | 805 | | 200 day DMA | 772.51 | EMA (exponential moving average) of Ksb KSB
| EMA period | EMA current | EMA prev | EMA prev2 | | 5 day EMA | 800.37 | 803.68 | 805.7 | | 12 day EMA | 804.12 | 806.01 | 807.17 | | 20 day EMA | 808.02 | 809.52 | 810.56 | | 35 day EMA | 810.79 | 811.79 | 812.51 | | 50 day EMA | 816.16 | 817.07 | 817.78 |
SMA (simple moving average) of Ksb KSB
| SMA period | SMA current | SMA prev | SMA prev2 | | 5 day SMA | 802.72 | 805.86 | 807.37 | | 12 day SMA | 803.01 | 803.71 | 804.33 | | 20 day SMA | 805.17 | 806.47 | 808.98 | | 35 day SMA | 819.78 | 820.56 | 821.01 | | 50 day SMA | 818.88 | 818.91 | 818.73 | | 100 day SMA | 829.34 | 830.02 | 830.39 | | 150 day SMA | 805 | 804.51 | 803.98 | | 200 day SMA | 772.51 | 772.37 | 772.21 |
|
|
