KrystalIntegrated KRYSTAL full analysis,charts,indicators,moving averages,SMA,DMA,EMA,ADX,MACD,RSIKrystal Integrated KRYSTAL WideScreen charts, DMA,SMA,EMA technical analysis, forecast prediction, by indicators ADX,MACD,RSI,CCI NSE stock exchange
Daily price and charts and targets KrystalIntegrated Strong Daily Stock price targets for KrystalIntegrated KRYSTAL are 596.95 and 607.95 | Daily Target 1 | 588.63 | | Daily Target 2 | 594.27 | | Daily Target 3 | 599.63333333333 | | Daily Target 4 | 605.27 | | Daily Target 5 | 610.63 |
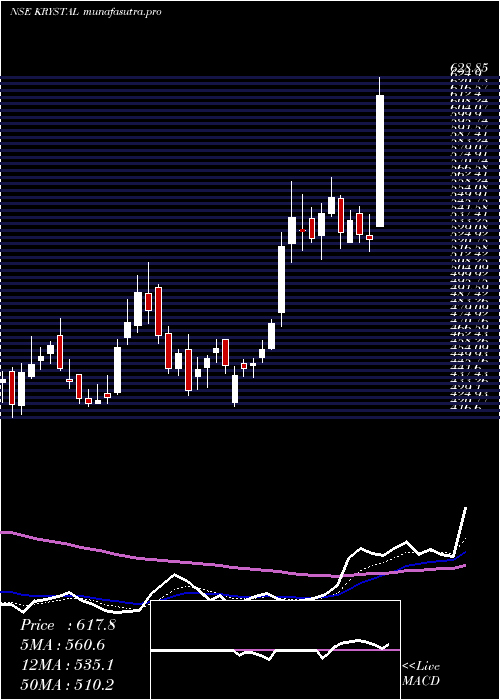
Daily price and volume Krystal Integrated
| Date |
Closing |
Open |
Range |
Volume |
Wed 29 October 2025 |
599.90 (1.09%) |
599.40 |
594.00 - 605.00 |
0.5784 times |
Tue 28 October 2025 |
593.45 (0.36%) |
603.00 |
591.10 - 610.00 |
2.2357 times |
Mon 27 October 2025 |
591.30 (-0.38%) |
594.50 |
590.00 - 597.80 |
0.4676 times |
Fri 24 October 2025 |
593.55 (-0.37%) |
591.00 |
591.00 - 601.95 |
0.3955 times |
Thu 23 October 2025 |
595.75 (-1.34%) |
612.95 |
590.25 - 612.95 |
0.5884 times |
Tue 21 October 2025 |
603.85 (1.08%) |
586.00 |
586.00 - 607.50 |
0.2094 times |
Mon 20 October 2025 |
597.40 (-0.2%) |
587.50 |
587.50 - 601.90 |
0.546 times |
Fri 17 October 2025 |
598.60 (-0.79%) |
600.00 |
577.95 - 607.90 |
3.4005 times |
Thu 16 October 2025 |
603.35 (-0.57%) |
611.15 |
600.15 - 617.70 |
0.58 times |
Wed 15 October 2025 |
606.80 (1.67%) |
592.30 |
592.30 - 612.45 |
0.9986 times |
Tue 14 October 2025 |
596.85 (-2.04%) |
610.25 |
580.00 - 613.65 |
2.8028 times |
Weekly price and charts KrystalIntegrated Strong weekly Stock price targets for KrystalIntegrated KRYSTAL are 594.95 and 614.95 | Weekly Target 1 | 579.97 | | Weekly Target 2 | 589.93 | | Weekly Target 3 | 599.96666666667 | | Weekly Target 4 | 609.93 | | Weekly Target 5 | 619.97 |
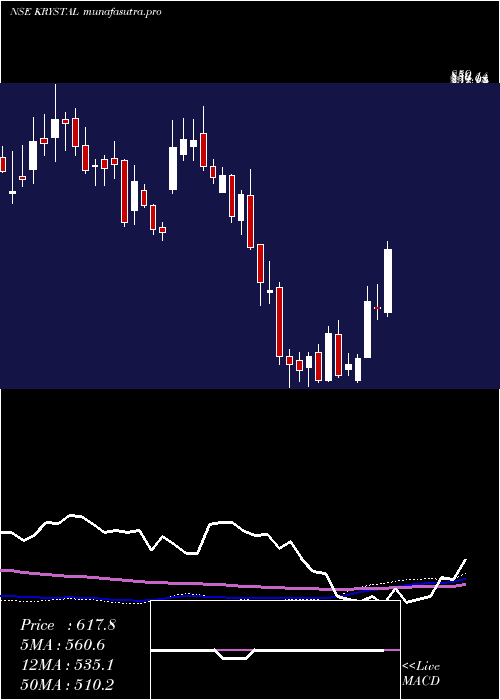
Weekly price and volumes for Krystal Integrated
| Date |
Closing |
Open |
Range |
Volume |
Wed 29 October 2025 |
599.90 (1.07%) |
594.50 |
590.00 - 610.00 |
0.366 times |
Fri 24 October 2025 |
593.55 (-0.84%) |
587.50 |
586.00 - 612.95 |
0.194 times |
Fri 17 October 2025 |
598.60 (-2.21%) |
603.50 |
577.95 - 617.70 |
0.9082 times |
Fri 10 October 2025 |
612.10 (-0.74%) |
654.00 |
604.50 - 654.00 |
0.9804 times |
Fri 03 October 2025 |
616.65 (0.19%) |
620.10 |
600.30 - 628.00 |
0.5542 times |
Fri 26 September 2025 |
615.45 (-5.82%) |
669.70 |
608.20 - 669.70 |
0.6732 times |
Fri 19 September 2025 |
653.50 (1.74%) |
638.00 |
638.00 - 696.00 |
1.4674 times |
Fri 12 September 2025 |
642.30 (-2.92%) |
684.00 |
638.30 - 705.00 |
0.8041 times |
Fri 05 September 2025 |
661.60 (0.02%) |
666.00 |
655.00 - 729.50 |
3.1047 times |
Fri 29 August 2025 |
661.45 (2.09%) |
645.00 |
631.00 - 692.00 |
0.9477 times |
Wed 21 May 2025 |
647.90 (-2.15%) |
673.00 |
631.30 - 714.80 |
3.1754 times |
Monthly price and charts KrystalIntegrated Strong monthly Stock price targets for KrystalIntegrated KRYSTAL are 550.9 and 626.95 | Monthly Target 1 | 534.57 | | Monthly Target 2 | 567.23 | | Monthly Target 3 | 610.61666666667 | | Monthly Target 4 | 643.28 | | Monthly Target 5 | 686.67 |
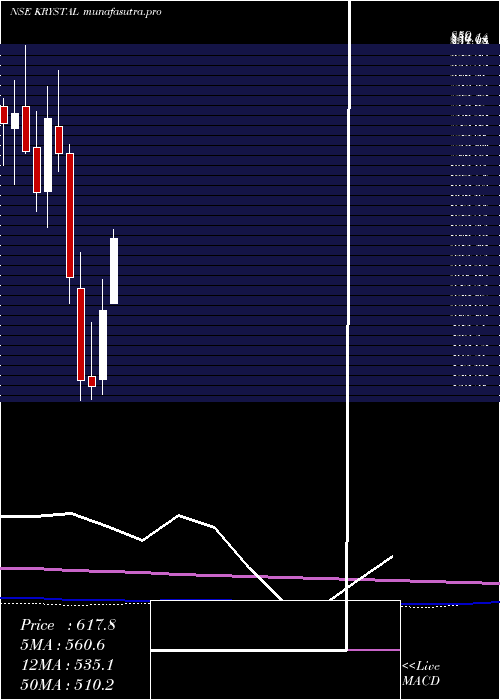
Monthly price and volumes Krystal Integrated
| Date |
Closing |
Open |
Range |
Volume |
Wed 29 October 2025 |
599.90 (-1.46%) |
602.00 |
577.95 - 654.00 |
0.2092 times |
Tue 30 September 2025 |
608.80 (-7.96%) |
666.00 |
601.65 - 729.50 |
0.4821 times |
Fri 29 August 2025 |
661.45 (2.09%) |
645.00 |
631.00 - 692.00 |
0.0724 times |
Wed 21 May 2025 |
647.90 (22.74%) |
536.00 |
536.00 - 716.00 |
3.0267 times |
Wed 30 April 2025 |
527.85 (21.86%) |
441.70 |
423.05 - 566.45 |
0.8468 times |
Fri 28 March 2025 |
433.15 (-1.65%) |
445.00 |
416.60 - 513.45 |
1.1909 times |
Fri 28 February 2025 |
440.40 (-22.61%) |
555.00 |
415.60 - 600.10 |
0.892 times |
Fri 31 January 2025 |
569.10 (-21.31%) |
723.60 |
536.25 - 735.00 |
0.6423 times |
Tue 31 December 2024 |
723.20 (-5.75%) |
757.00 |
701.00 - 827.25 |
1.1246 times |
Fri 29 November 2024 |
767.30 (13.75%) |
676.00 |
631.00 - 807.00 |
1.513 times |
Thu 31 October 2024 |
674.55 (-7.09%) |
731.00 |
651.10 - 776.00 |
0.9834 times |
DMA SMA EMA moving averages of Krystal Integrated KRYSTAL
DMA (daily moving average) of Krystal Integrated KRYSTAL
| DMA period | DMA value | | 5 day DMA | 594.79 | | 12 day DMA | 599.17 | | 20 day DMA | 605.55 | | 35 day DMA | 624.1 | | 50 day DMA | 638.66 | | 100 day DMA | 572.17 | | 150 day DMA | 588.63 | | 200 day DMA | 621.33 | EMA (exponential moving average) of Krystal Integrated KRYSTAL
| EMA period | EMA current | EMA prev | EMA prev2 | | 5 day EMA | 596.61 | 594.96 | 595.71 | | 12 day EMA | 600.8 | 600.96 | 602.32 | | 20 day EMA | 607.86 | 608.7 | 610.31 | | 35 day EMA | 621.68 | 622.96 | 624.7 | | 50 day EMA | 636.63 | 638.13 | 639.95 |
SMA (simple moving average) of Krystal Integrated KRYSTAL
| SMA period | SMA current | SMA prev | SMA prev2 | | 5 day SMA | 594.79 | 595.58 | 596.37 | | 12 day SMA | 599.17 | 600.19 | 601.56 | | 20 day SMA | 605.55 | 606.55 | 607.65 | | 35 day SMA | 624.1 | 626.23 | 628.18 | | 50 day SMA | 638.66 | 640.05 | 641.52 | | 100 day SMA | 572.17 | 570.67 | 569.23 | | 150 day SMA | 588.63 | 589.81 | 591.16 | | 200 day SMA | 621.33 | 622.05 | 622.71 |
|
|
