KotyarkIndustries KOTYARK_ST full analysis,charts,indicators,moving averages,SMA,DMA,EMA,ADX,MACD,RSIKotyark Industries KOTYARK_ST WideScreen charts, DMA,SMA,EMA technical analysis, forecast prediction, by indicators ADX,MACD,RSI,CCI NSE stock exchange
Daily price and charts and targets KotyarkIndustries Strong Daily Stock price targets for KotyarkIndustries KOTYARK_ST are 274.6 and 285.2 | Daily Target 1 | 272.53 | | Daily Target 2 | 276.67 | | Daily Target 3 | 283.13333333333 | | Daily Target 4 | 287.27 | | Daily Target 5 | 293.73 |
Daily price and volume Kotyark Industries
| Date |
Closing |
Open |
Range |
Volume |
Tue 28 October 2025 |
280.80 (-2.74%) |
288.70 |
279.00 - 289.60 |
2.1258 times |
Mon 27 October 2025 |
288.70 (-3.28%) |
295.00 |
287.00 - 298.50 |
1.1063 times |
Fri 24 October 2025 |
298.50 (2.63%) |
283.70 |
283.00 - 298.90 |
1.4317 times |
Thu 23 October 2025 |
290.85 (-0.39%) |
292.00 |
285.60 - 292.00 |
0.9544 times |
Tue 21 October 2025 |
292.00 (1.62%) |
287.50 |
287.40 - 292.95 |
0.2603 times |
Mon 20 October 2025 |
287.35 (-0.31%) |
293.90 |
285.10 - 295.00 |
0.6941 times |
Fri 17 October 2025 |
288.25 (-2.29%) |
287.20 |
287.20 - 295.95 |
1.3232 times |
Thu 16 October 2025 |
295.00 (-0.27%) |
292.00 |
289.90 - 295.00 |
0.6941 times |
Wed 15 October 2025 |
295.80 (1.48%) |
285.25 |
285.25 - 296.70 |
0.4121 times |
Tue 14 October 2025 |
291.50 (-2.07%) |
298.50 |
290.05 - 298.90 |
0.9978 times |
Mon 13 October 2025 |
297.65 (-2.1%) |
309.00 |
297.30 - 309.00 |
0.6291 times |
Weekly price and charts KotyarkIndustries Strong weekly Stock price targets for KotyarkIndustries KOTYARK_ST are 270.15 and 289.65 | Weekly Target 1 | 266.6 | | Weekly Target 2 | 273.7 | | Weekly Target 3 | 286.1 | | Weekly Target 4 | 293.2 | | Weekly Target 5 | 305.6 |
Weekly price and volumes for Kotyark Industries
| Date |
Closing |
Open |
Range |
Volume |
Tue 28 October 2025 |
280.80 (-5.93%) |
295.00 |
279.00 - 298.50 |
0.4593 times |
Fri 24 October 2025 |
298.50 (3.56%) |
293.90 |
283.00 - 298.90 |
0.4747 times |
Fri 17 October 2025 |
288.25 (-5.2%) |
309.00 |
285.25 - 309.00 |
0.5764 times |
Fri 10 October 2025 |
304.05 (-0.16%) |
300.40 |
290.55 - 305.50 |
0.5795 times |
Fri 03 October 2025 |
304.55 (-5.21%) |
321.30 |
300.00 - 337.00 |
0.7799 times |
Fri 26 September 2025 |
321.30 (5.48%) |
304.60 |
291.00 - 321.30 |
1.9482 times |
Fri 19 September 2025 |
304.60 (3.48%) |
289.10 |
280.05 - 312.80 |
1.008 times |
Fri 12 September 2025 |
294.35 (-11.59%) |
321.60 |
283.10 - 332.40 |
1.5845 times |
Fri 05 September 2025 |
332.95 (-0.73%) |
349.70 |
325.00 - 362.00 |
1.3841 times |
Fri 29 August 2025 |
335.40 (48.37%) |
340.80 |
316.80 - 359.95 |
1.2053 times |
Fri 01 August 2025 |
226.05 (-1.44%) |
234.00 |
218.00 - 240.80 |
0.9464 times |
Monthly price and charts KotyarkIndustries Strong monthly Stock price targets for KotyarkIndustries KOTYARK_ST are 260.9 and 298.9 | Monthly Target 1 | 254.27 | | Monthly Target 2 | 267.53 | | Monthly Target 3 | 292.26666666667 | | Monthly Target 4 | 305.53 | | Monthly Target 5 | 330.27 |
Monthly price and volumes Kotyark Industries
| Date |
Closing |
Open |
Range |
Volume |
Tue 28 October 2025 |
280.80 (-10.94%) |
312.00 |
279.00 - 317.00 |
0.3095 times |
Tue 30 September 2025 |
315.30 (-5.99%) |
349.70 |
280.05 - 362.00 |
0.8168 times |
Fri 29 August 2025 |
335.40 (48.8%) |
225.00 |
225.00 - 359.95 |
0.1737 times |
Thu 31 July 2025 |
225.40 (-28.52%) |
319.45 |
202.40 - 338.00 |
2.1492 times |
Mon 30 June 2025 |
315.35 (-13.73%) |
358.25 |
295.25 - 358.25 |
0.6881 times |
Fri 30 May 2025 |
365.55 (2.51%) |
350.20 |
329.30 - 430.85 |
0.5263 times |
Wed 30 April 2025 |
356.60 (14.79%) |
315.00 |
310.00 - 386.50 |
1.0008 times |
Fri 28 March 2025 |
310.65 (-43.63%) |
545.00 |
303.00 - 578.00 |
3.1319 times |
Fri 28 February 2025 |
551.10 (-16.18%) |
642.25 |
548.85 - 768.00 |
1.1299 times |
Fri 31 January 2025 |
657.50 (971.72%) |
655.00 |
630.00 - 679.15 |
0.0738 times |
Tue 16 November 2021 |
61.35 (0%) |
51.00 |
43.50 - 61.35 |
3.4662 times |

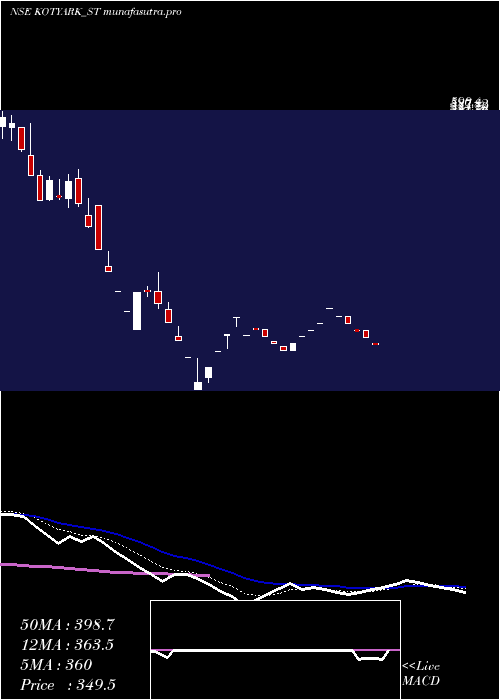
DMA SMA EMA moving averages of Kotyark Industries KOTYARK_ST
DMA (daily moving average) of Kotyark Industries KOTYARK_ST
| DMA period | DMA value | | 5 day DMA | 290.17 | | 12 day DMA | 292.54 | | 20 day DMA | 297.27 | | 35 day DMA | 301.97 | | 50 day DMA | 300.35 | | 100 day DMA | 308.76 | | 150 day DMA | 339.21 | | 200 day DMA | | EMA (exponential moving average) of Kotyark Industries KOTYARK_ST
| EMA period | EMA current | EMA prev | EMA prev2 | | 5 day EMA | 288.29 | 292.04 | 293.71 | | 12 day EMA | 292.16 | 294.22 | 295.22 | | 20 day EMA | 294.55 | 296 | 296.77 | | 35 day EMA | 294.3 | 295.09 | 295.47 | | 50 day EMA | 294.15 | 294.69 | 294.93 |
SMA (simple moving average) of Kotyark Industries KOTYARK_ST
| SMA period | SMA current | SMA prev | SMA prev2 | | 5 day SMA | 290.17 | 291.48 | 291.39 | | 12 day SMA | 292.54 | 293.61 | 293.98 | | 20 day SMA | 297.27 | 299.29 | 300.16 | | 35 day SMA | 301.97 | 303.46 | 304.88 | | 50 day SMA | 300.35 | 299.32 | 298.27 | | 100 day SMA | 308.76 | 309.68 | 310.34 | | 150 day SMA | 339.21 | 341.41 | 343.44 | | 200 day SMA |
|
|
