KitexGarments KITEX full analysis,charts,indicators,moving averages,SMA,DMA,EMA,ADX,MACD,RSIKitex Garments KITEX WideScreen charts, DMA,SMA,EMA technical analysis, forecast prediction, by indicators ADX,MACD,RSI,CCI NSE stock exchange
operates under Other Apparels & Accessories sector
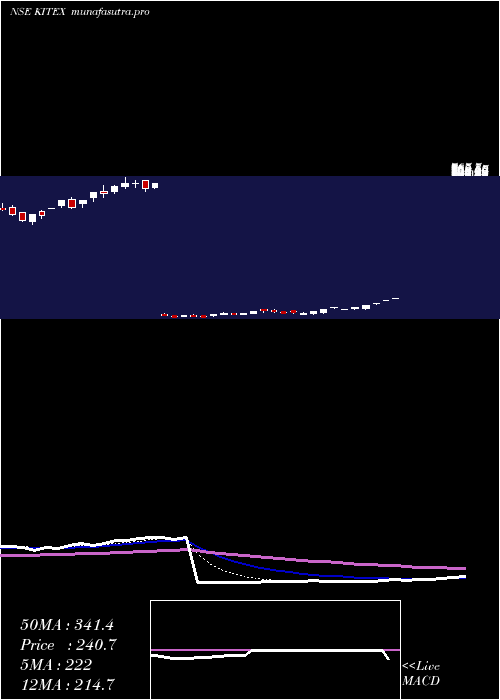
Daily price and charts and targets KitexGarments Strong Daily Stock price targets for KitexGarments KITEX are 207.56 and 213.08 | Daily Target 1 | 203.43 | | Daily Target 2 | 206.16 | | Daily Target 3 | 208.94666666667 | | Daily Target 4 | 211.68 | | Daily Target 5 | 214.47 |
Daily price and volume Kitex Garments
| Date |
Closing |
Open |
Range |
Volume |
Tue 28 October 2025 |
208.90 (0.11%) |
208.68 |
206.21 - 211.73 |
0.4835 times |
Mon 27 October 2025 |
208.68 (-6.05%) |
224.89 |
207.10 - 228.00 |
1.1062 times |
Fri 24 October 2025 |
222.11 (3.92%) |
213.73 |
210.00 - 232.70 |
3.0517 times |
Thu 23 October 2025 |
213.73 (14.43%) |
208.00 |
204.48 - 219.95 |
4.2621 times |
Tue 21 October 2025 |
186.78 (0.34%) |
187.80 |
185.00 - 189.23 |
0.0471 times |
Mon 20 October 2025 |
186.15 (-0.92%) |
188.80 |
184.97 - 188.99 |
0.1184 times |
Fri 17 October 2025 |
187.88 (-1.94%) |
191.59 |
186.00 - 191.59 |
0.1973 times |
Thu 16 October 2025 |
191.59 (3.28%) |
190.00 |
187.08 - 193.88 |
0.3802 times |
Wed 15 October 2025 |
185.51 (0.17%) |
185.00 |
182.93 - 187.50 |
0.1502 times |
Tue 14 October 2025 |
185.20 (-1.52%) |
188.25 |
183.31 - 190.19 |
0.2034 times |
Mon 13 October 2025 |
188.06 (-1.29%) |
190.00 |
186.22 - 194.40 |
0.3681 times |
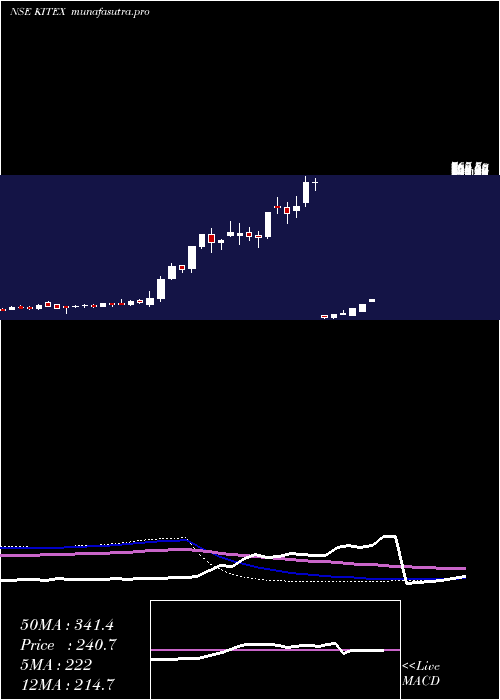
Weekly price and charts KitexGarments Strong weekly Stock price targets for KitexGarments KITEX are 196.66 and 218.45 | Weekly Target 1 | 192.58 | | Weekly Target 2 | 200.74 | | Weekly Target 3 | 214.37 | | Weekly Target 4 | 222.53 | | Weekly Target 5 | 236.16 |
Weekly price and volumes for Kitex Garments
| Date |
Closing |
Open |
Range |
Volume |
Tue 28 October 2025 |
208.90 (-5.95%) |
224.89 |
206.21 - 228.00 |
0.7157 times |
Fri 24 October 2025 |
222.11 (18.22%) |
188.80 |
184.97 - 232.70 |
3.3672 times |
Fri 17 October 2025 |
187.88 (-1.38%) |
190.00 |
182.93 - 194.40 |
0.5849 times |
Fri 10 October 2025 |
190.51 (1.35%) |
192.74 |
176.00 - 199.15 |
0.8488 times |
Fri 03 October 2025 |
187.98 (-1.57%) |
191.85 |
183.75 - 193.78 |
0.4151 times |
Fri 26 September 2025 |
190.98 (-13.28%) |
219.00 |
189.61 - 219.00 |
0.7627 times |
Fri 19 September 2025 |
220.22 (11.22%) |
196.00 |
192.10 - 223.54 |
1.1006 times |
Fri 12 September 2025 |
198.01 (8.04%) |
185.85 |
183.90 - 204.60 |
0.5414 times |
Fri 05 September 2025 |
183.28 (2.95%) |
182.00 |
179.55 - 197.00 |
0.9337 times |
Fri 29 August 2025 |
178.03 (-9.99%) |
194.73 |
169.56 - 194.86 |
0.7299 times |
Fri 22 August 2025 |
197.78 (15.47%) |
179.79 |
175.30 - 218.50 |
1.1098 times |
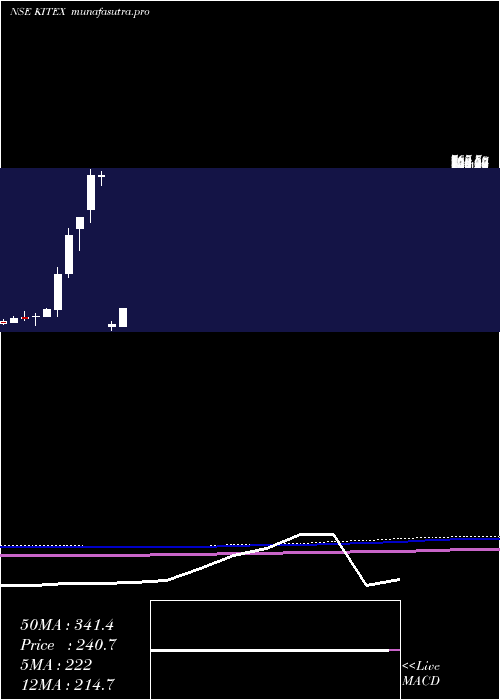
Monthly price and charts KitexGarments Strong monthly Stock price targets for KitexGarments KITEX are 192.45 and 249.15 | Monthly Target 1 | 149.17 | | Monthly Target 2 | 179.03 | | Monthly Target 3 | 205.86666666667 | | Monthly Target 4 | 235.73 | | Monthly Target 5 | 262.57 |
Monthly price and volumes Kitex Garments
| Date |
Closing |
Open |
Range |
Volume |
Tue 28 October 2025 |
208.90 (11.92%) |
186.40 |
176.00 - 232.70 |
2.7323 times |
Tue 30 September 2025 |
186.65 (4.84%) |
182.00 |
179.55 - 223.54 |
1.6847 times |
Fri 29 August 2025 |
178.03 (-36.99%) |
211.00 |
158.10 - 223.00 |
1.5976 times |
Tue 15 July 2025 |
282.55 (0.43%) |
285.00 |
270.55 - 303.95 |
0.576 times |
Mon 30 June 2025 |
281.35 (-8.94%) |
252.10 |
247.00 - 291.25 |
0.2384 times |
Thu 22 May 2025 |
308.98 (28.36%) |
266.86 |
241.40 - 314.00 |
1.2036 times |
Wed 16 April 2025 |
240.72 (33.63%) |
171.15 |
169.71 - 240.72 |
0.5847 times |
Fri 28 March 2025 |
180.14 (-75.74%) |
170.75 |
155.65 - 191.52 |
0.4407 times |
Wed 04 December 2024 |
742.55 (0.01%) |
741.80 |
707.45 - 757.50 |
0.0733 times |
Fri 29 November 2024 |
742.45 (27.11%) |
613.30 |
564.35 - 767.70 |
0.8686 times |
Thu 31 October 2024 |
584.10 (13.16%) |
541.95 |
460.80 - 584.10 |
0.8595 times |
DMA SMA EMA moving averages of Kitex Garments KITEX
DMA (daily moving average) of Kitex Garments KITEX
| DMA period | DMA value | | 5 day DMA | 208.04 | | 12 day DMA | 196.26 | | 20 day DMA | 191.53 | | 35 day DMA | 196.14 | | 50 day DMA | 193.16 | | 100 day DMA | 214.73 | | 150 day DMA | 317.77 | | 200 day DMA | 332.04 | EMA (exponential moving average) of Kitex Garments KITEX
| EMA period | EMA current | EMA prev | EMA prev2 | | 5 day EMA | 206.97 | 206.01 | 204.68 | | 12 day EMA | 199.89 | 198.25 | 196.36 | | 20 day EMA | 196.87 | 195.6 | 194.22 | | 35 day EMA | 193.33 | 192.41 | 191.45 | | 50 day EMA | 193.03 | 192.38 | 191.72 |
SMA (simple moving average) of Kitex Garments KITEX
| SMA period | SMA current | SMA prev | SMA prev2 | | 5 day SMA | 208.04 | 203.49 | 199.33 | | 12 day SMA | 196.26 | 193.7 | 191.34 | | 20 day SMA | 191.53 | 190.63 | 190.18 | | 35 day SMA | 196.14 | 195.41 | 194.57 | | 50 day SMA | 193.16 | 192.57 | 191.81 | | 100 day SMA | 214.73 | 214.35 | 213.98 | | 150 day SMA | 317.77 | 320.09 | 322.31 | | 200 day SMA | 332.04 | 332.09 | 332.13 |
|
|
